realestatebr provides a unified interface to Brazilian real estate data. The package is organized by source, and each source holds one or more tables. Most tables are returned as tidy tibbles. Large relational datasets use lazy DuckDB tables so users can filter and aggregate them before loading results into R memory.
Installation
# Install the released version from CRAN
install.packages("realestatebr")

# Or install the development version from GitHub
# install.packages("remotes")
remotes::install_github("viniciusoike/realestatebr")
Quick Start
list_datasets() lists available datasets and their access modes. get_dataset() retrieves materialized datasets, while query_dataset() opens large relational datasets as lazy DuckDB tables.
library(realestatebr)

# Discover available datasets
datasets <- list_datasets()

# Get specific table
sbpe <- get_dataset(name = "abecip", table = "sbpe")

# Get property price indices
fipezap <- get_dataset("rppi", "fipezap")

# Open related CNO tables lazily
cno <- query_dataset("cno")
cno$constructions
Available Datasets
The package wraps public data sources and returns each table in a tidy format. Update schedules vary by source.
| Dataset | Source | Tables |
|---|---|---|
abecip |
ABECIP |
sbpe, units, cgi
|
abrainc |
ABRAINC / FIPE |
indicator, radar, leading
|
bcb_realestate |
Banco Central do Brasil |
accounting, application, indices, sources, units
|
bcb_series |
Banco Central do Brasil |
core, primary, secondary, tertiary, full
|
cno |
Receita Federal |
constructions, areas, cnaes, responsibilities
|
fgv_ibre |
FGV IBRE | — |
mcmv |
Ministério das Cidades |
financing, financing_summary, subsidized_projects
|
paic |
IBGE |
activity, size, state
|
pim_pf_construction |
IBGE | — |
pnad_housing |
IBGE |
tenure, dwelling_type, household_size, mean_household_size, household_composition
|
rppi |
FIPE/ZAP, IVG-R, IGMI-R, IQA, IQAIW, IVAR, SECOVI-SP |
sale, rent, all, fipezap, ivgr, igmi, iqa, iqaiw, ivar, secovi_sp
|
rppi_bis |
Bank for International Settlements |
selected, detailed_monthly, detailed_quarterly, detailed_annual, detailed_halfyearly
|
secovi |
SECOVI-SP |
condo, rent, launch, sale
|
sinapi |
IBGE | — |
cno and mcmv use query_dataset() and return related lazy tables. The remaining datasets use get_dataset() and return data in memory.
Data Sources
The source parameter controls where data comes from.
# Auto (default): in-session memo -> GitHub release -> fresh download
data <- get_dataset("abecip")

# Pre-processed asset from the package's GitHub release
data <- get_dataset("abecip", source = "github")

# Fresh download from the original source
data <- get_dataset("abecip", source = "fresh")
Repeated calls within one R session are served from an in-memory memo. Use clear_session_cache() to drop the memo without restarting R.
Example: Property Price Indices
library(ggplot2)
library(realestatebr)
library(dplyr)

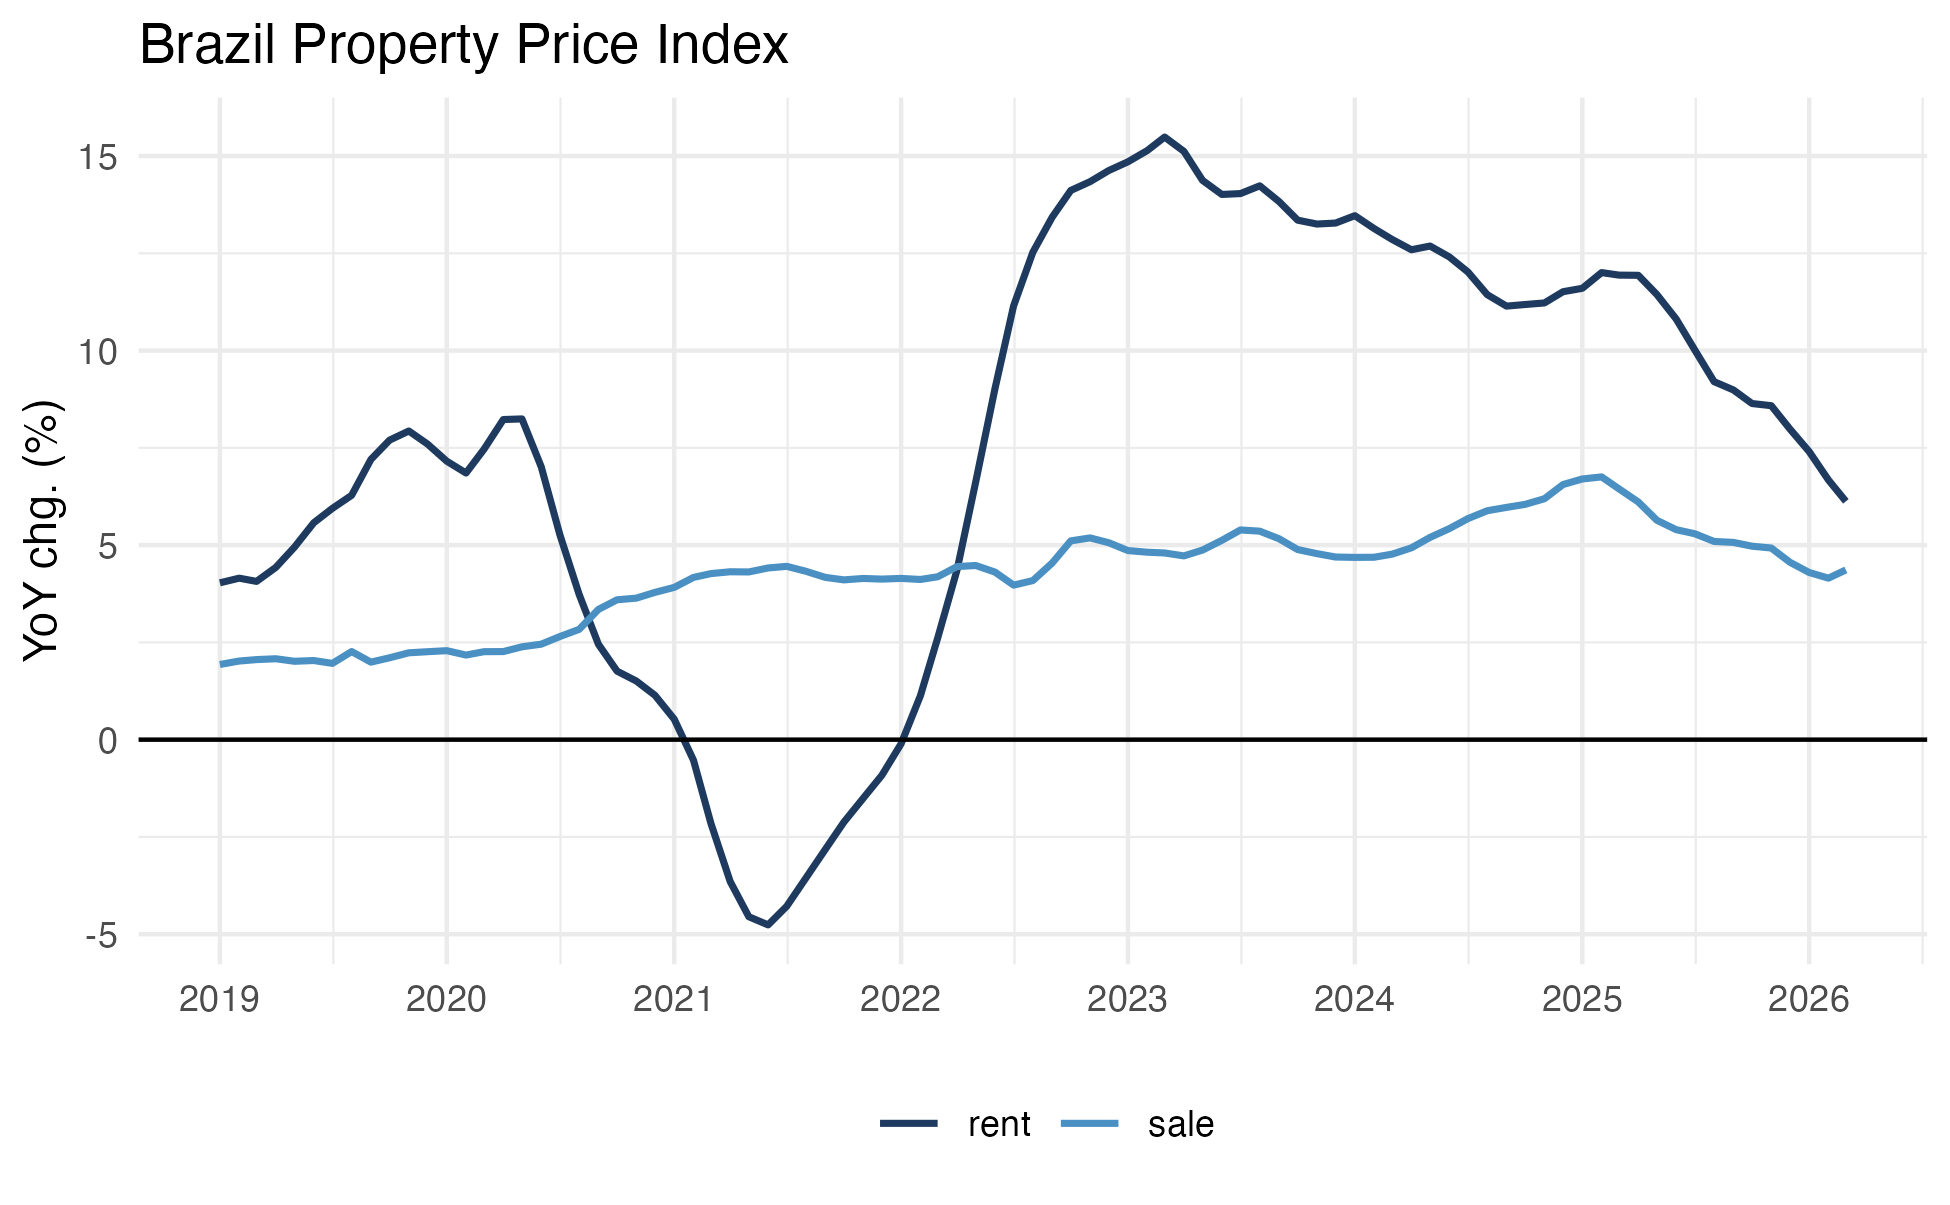
# Get FipeZap index
fipezap <- get_dataset("rppi", table = "fipezap")

# Residential sale and rent prices in São Paulo
rppi_spo <- fipezap |>
  filter(
    name_muni == "São Paulo",
    market == "residential",
    rooms == "total",
    variable == "acum12m",
    date >= as.Date("2019-01-01")
  )

ggplot(rppi_spo, aes(x = date, y = value, color = rent_sale)) +
  geom_line(lwd = 0.8) +
  geom_hline(yintercept = 0) +
  scale_x_date(date_breaks = "1 year", date_labels = "%Y") +
  scale_y_continuous(labels = scales::label_percent()) +
  labs(
    title = "São Paulo Property Price Index",
    x = NULL,
    y = "Year-on-year change",
    color = ""
  ) +
  theme_minimal() +
  theme(
    legend.position = "bottom",
    palette.colour.discrete = c("#1E3A5F", "#4A90C2", "#2C7A7B")
  )
International Comparison
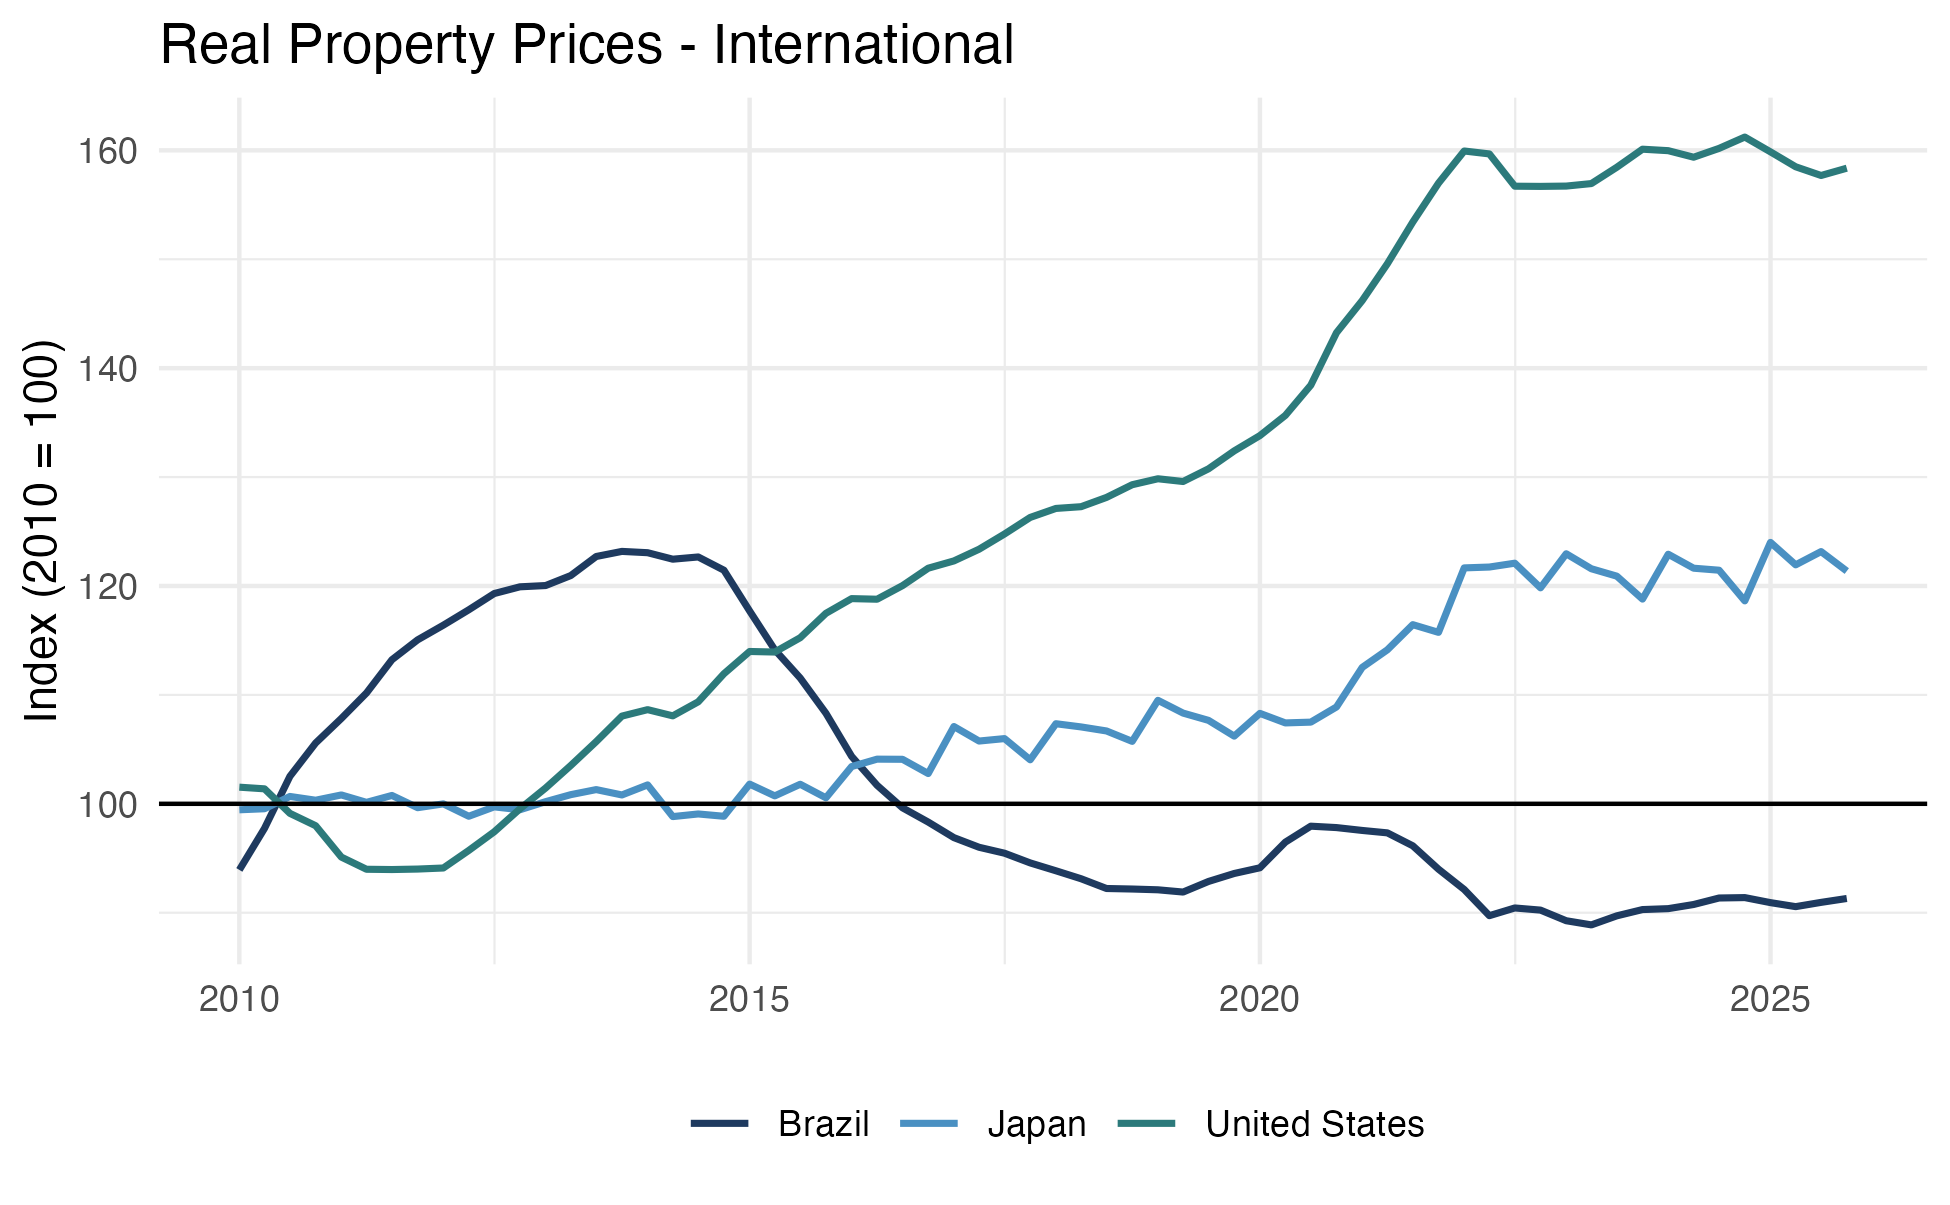
# Get BIS international data
bis <- get_dataset("rppi_bis")

# Compare countries
bis_compare <- bis |>
  filter(
    ref_area_name %in% c("Brazil", "United States", "Japan"),
    is_nominal == 0,
    unit == "index",
    date >= as.Date("2010-01-01")
  )

ggplot(bis_compare, aes(x = date, y = value, color = ref_area_name)) +
  geom_line(lwd = 0.8) +
  geom_hline(yintercept = 100) +
  labs(
    title = "Real Property Prices Across Countries",
    x = NULL,
    y = "Index (2010 = 100)",
    color = ""
  ) +
  theme_minimal() +
  theme(
    legend.position = "bottom",
    palette.colour.discrete = c("#1E3A5F", "#4A90C2", "#2C7A7B")
  )