Overview
ekioplot implements EKIO’s visual identity system for data visualization in R.
library(ekioplot)
library(ggplot2)

ggplot(mtcars, aes(wt, mpg, color = factor(cyl))) +
  geom_point(size = 3) +
  scale_color_ekio_d("full") +
  labs(
    title = "Fuel Efficiency vs. Weight",
    subtitle = "Motor Trend Car Road Tests (1974)",
    x = "Weight (1000 lbs)",
    y = "Miles per Gallon",
    color = "Cylinders"
  ) +
  theme_ekio()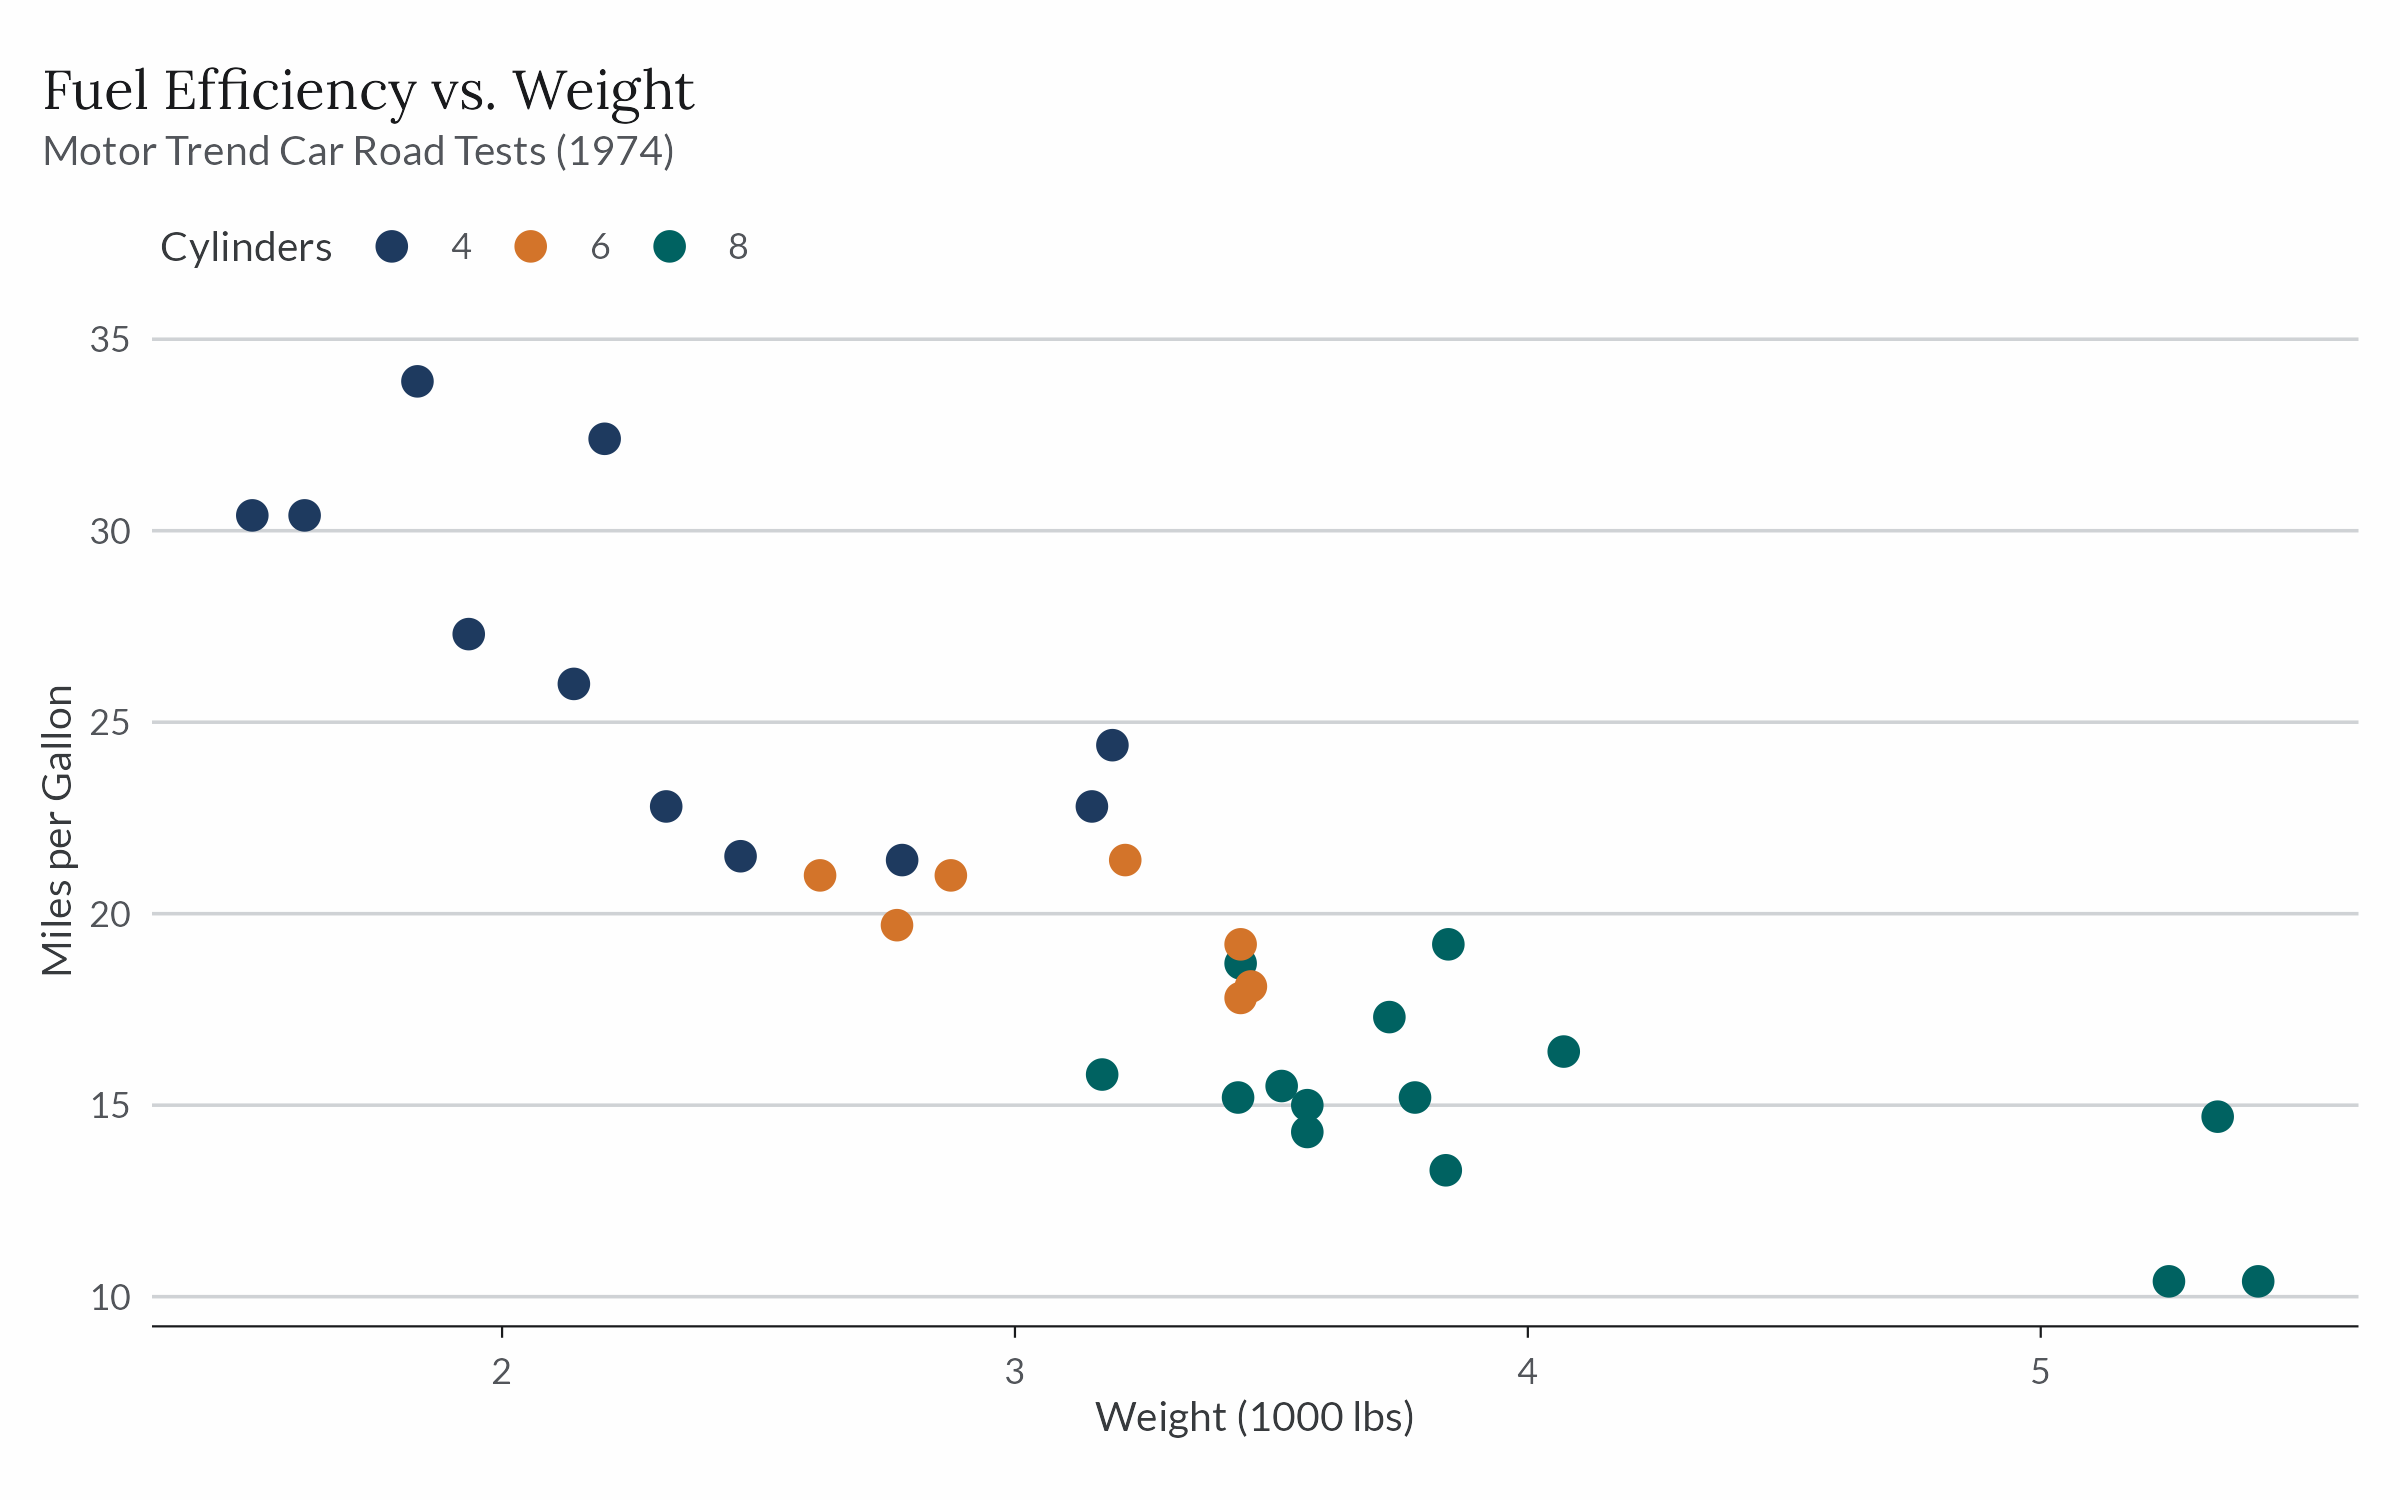
Installation
Install the released version from CRAN:
install.packages("ekioplot")Install the development version from r-universe:
install.packages(
  "ekioplot",
  repos = c(
    "https://viniciusoike.r-universe.dev",
    "https://cloud.r-project.org"
  )
)
Alternatively, install the development version from GitHub.
# install.packages("pak")
pak::pak("viniciusoike/ekioplot")
Themes
theme_ekio() applies EKIO’s visual identity to any ggplot2 plot, building on theme_minimal() with curated typography, spacing, and color. The grid argument controls which major grid lines are drawn ("y", "x", "xy", or "none"). Choose the warm off-white, white, or cool-white surface with the background argument, or pass a custom hex color. ekio_surface() resolves a named surface to its hex code.
theme_ekio(grid = "xy")
theme_ekio(background = "cold")
ekio_surface("offwhite")
Color palettes
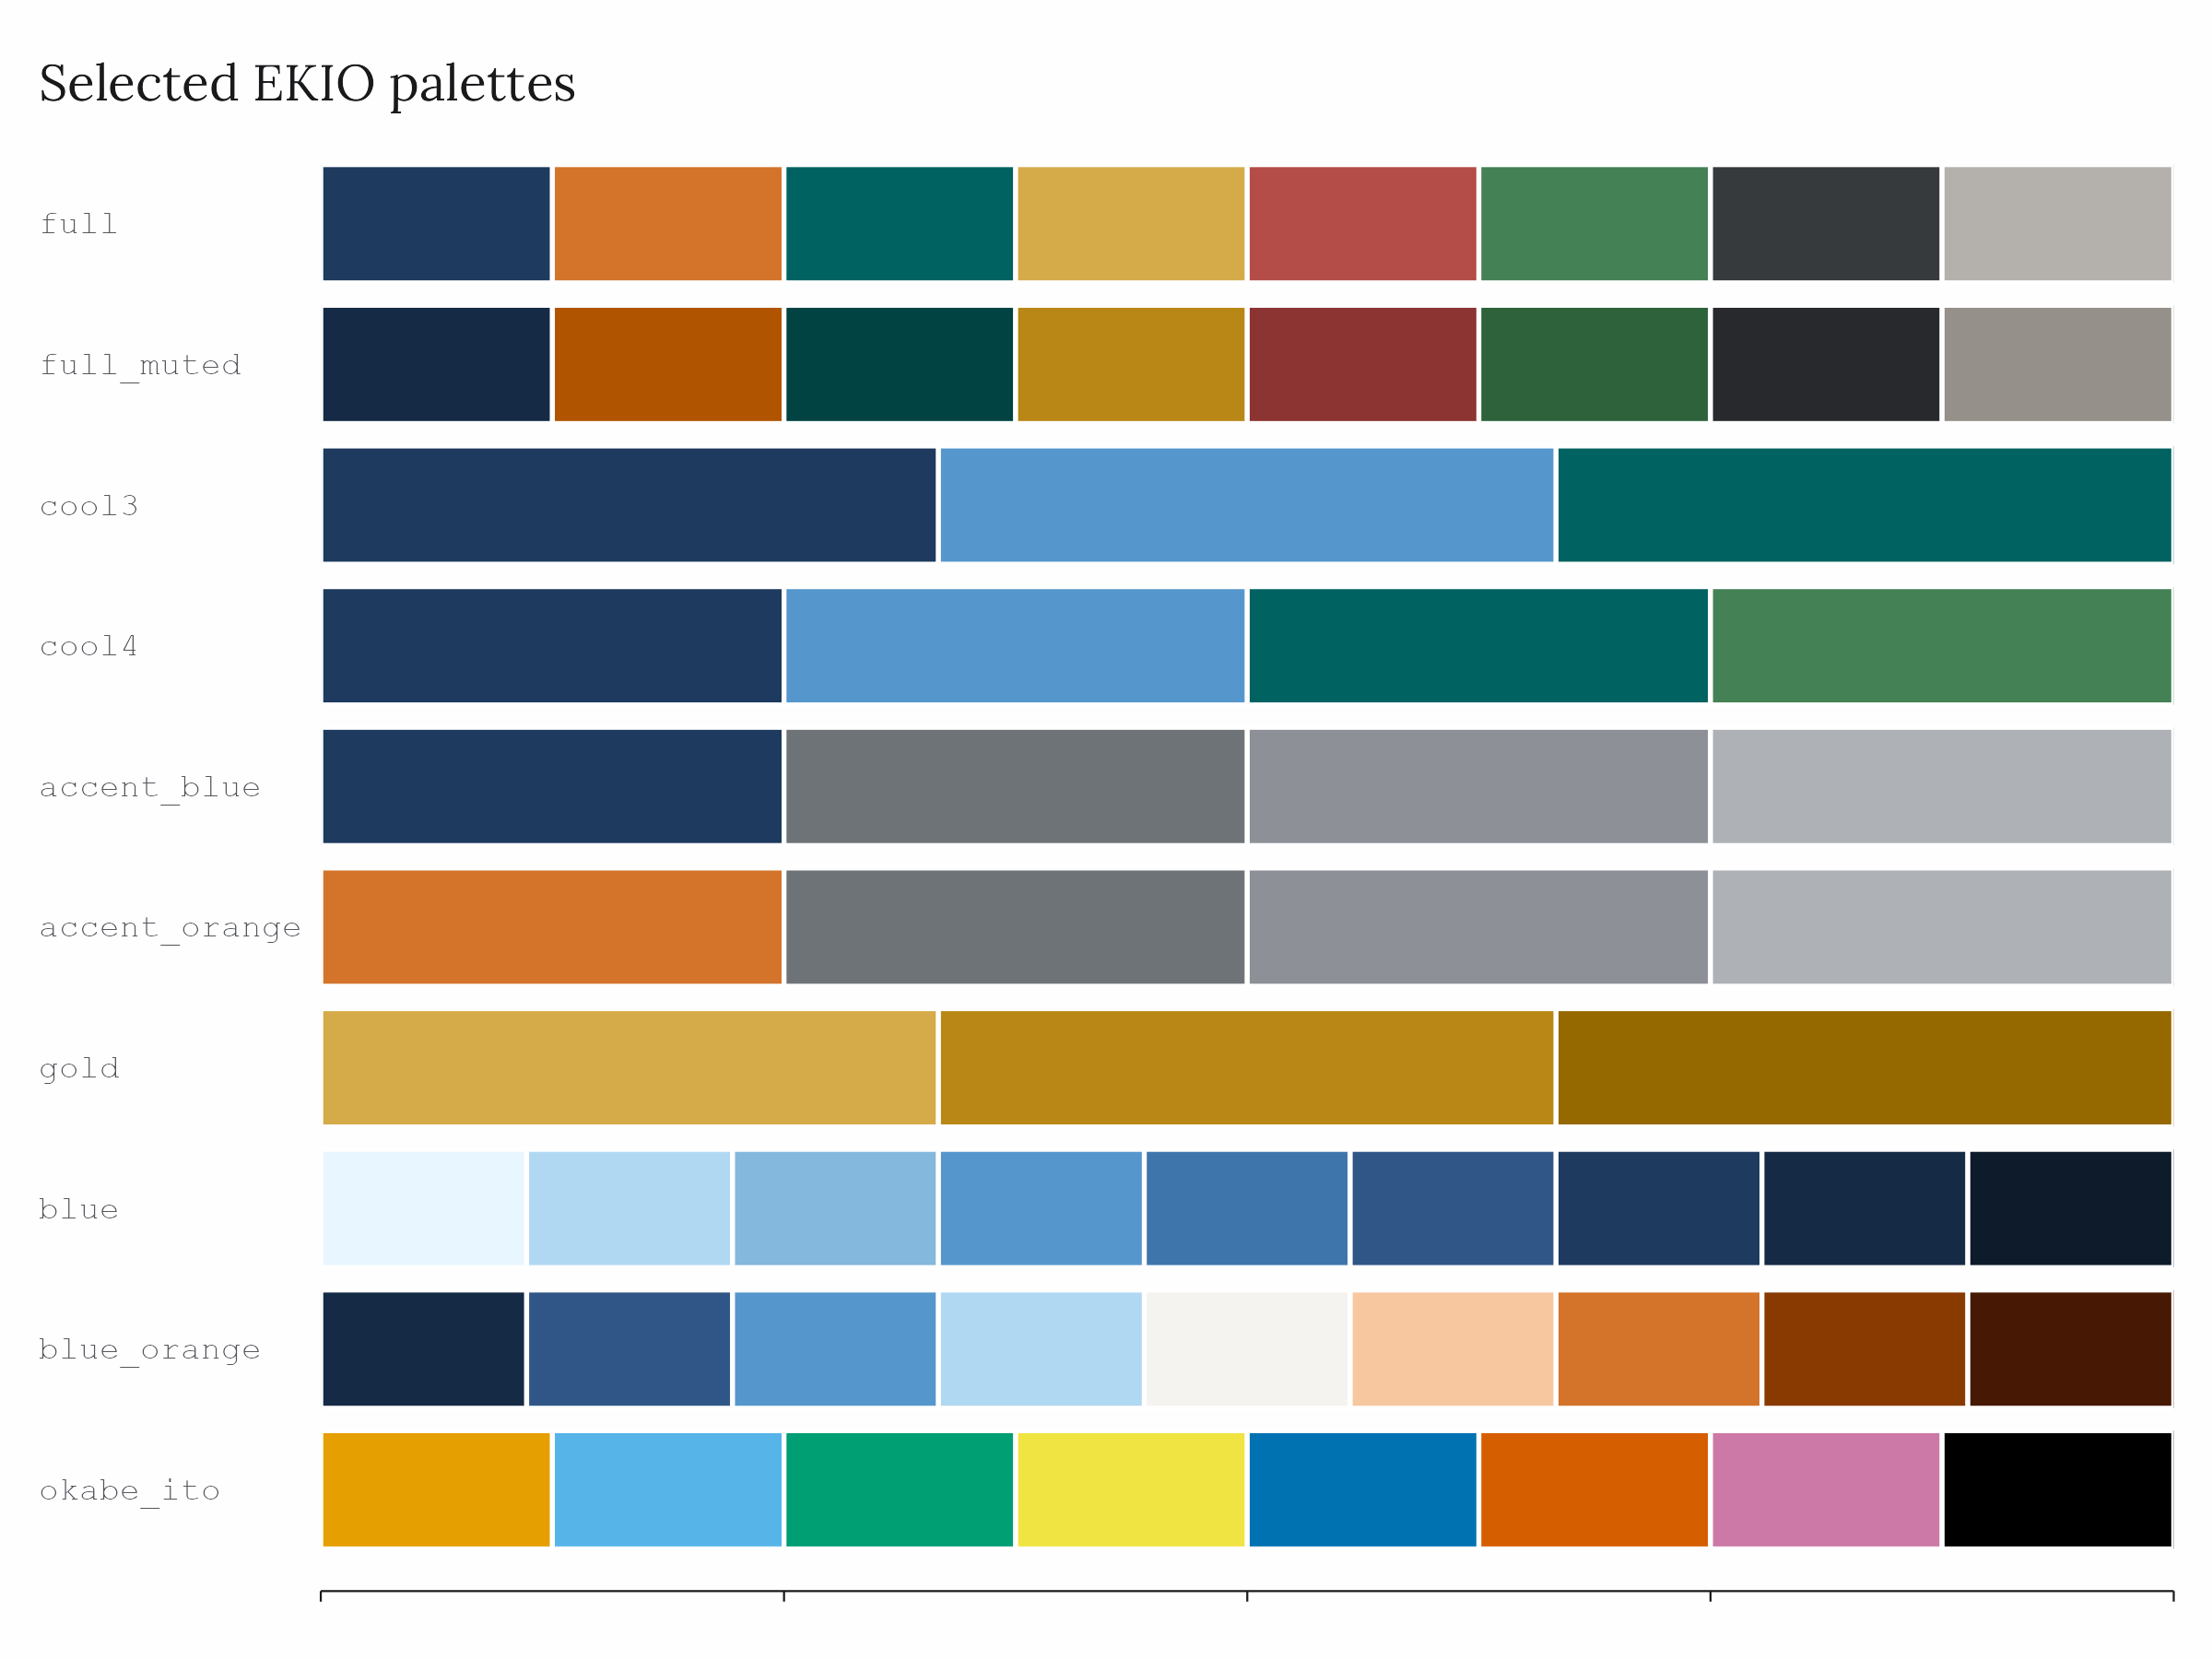
ekioplot ships palettes across seven groups, all accessible through a single function. The brand scales are generated from one OKLCH specification, so a given shade carries the same visual weight in every family.
Compact categorical palettes ("cool3", "cool4") cover small groups; "full_muted" provides a quieter eight-color alternative. For bars, boxplots, and areas, "full_light" lightens "full", and "spectrum_light" orders light colors around the color wheel. Variable-size accent palettes keep blue or orange prominent against two to six series. The named "ekio_brand" palette collects EKIO identity colors for brand assets; it is not intended for general data visualization. The "academy" palettes, "yoro_blue" and "yoro_green", are five-step ramps for EKIO Academy tutorials and books, tuned for the cold background.
Scales
Discrete and continuous scales are provided for both color and fill.
# Discrete (categorical palettes)
scale_color_ekio_d("full")
scale_fill_ekio_d("full")

# Continuous (sequential / diverging palettes)
scale_color_ekio_c("blue")
scale_fill_ekio_c("purple_orange")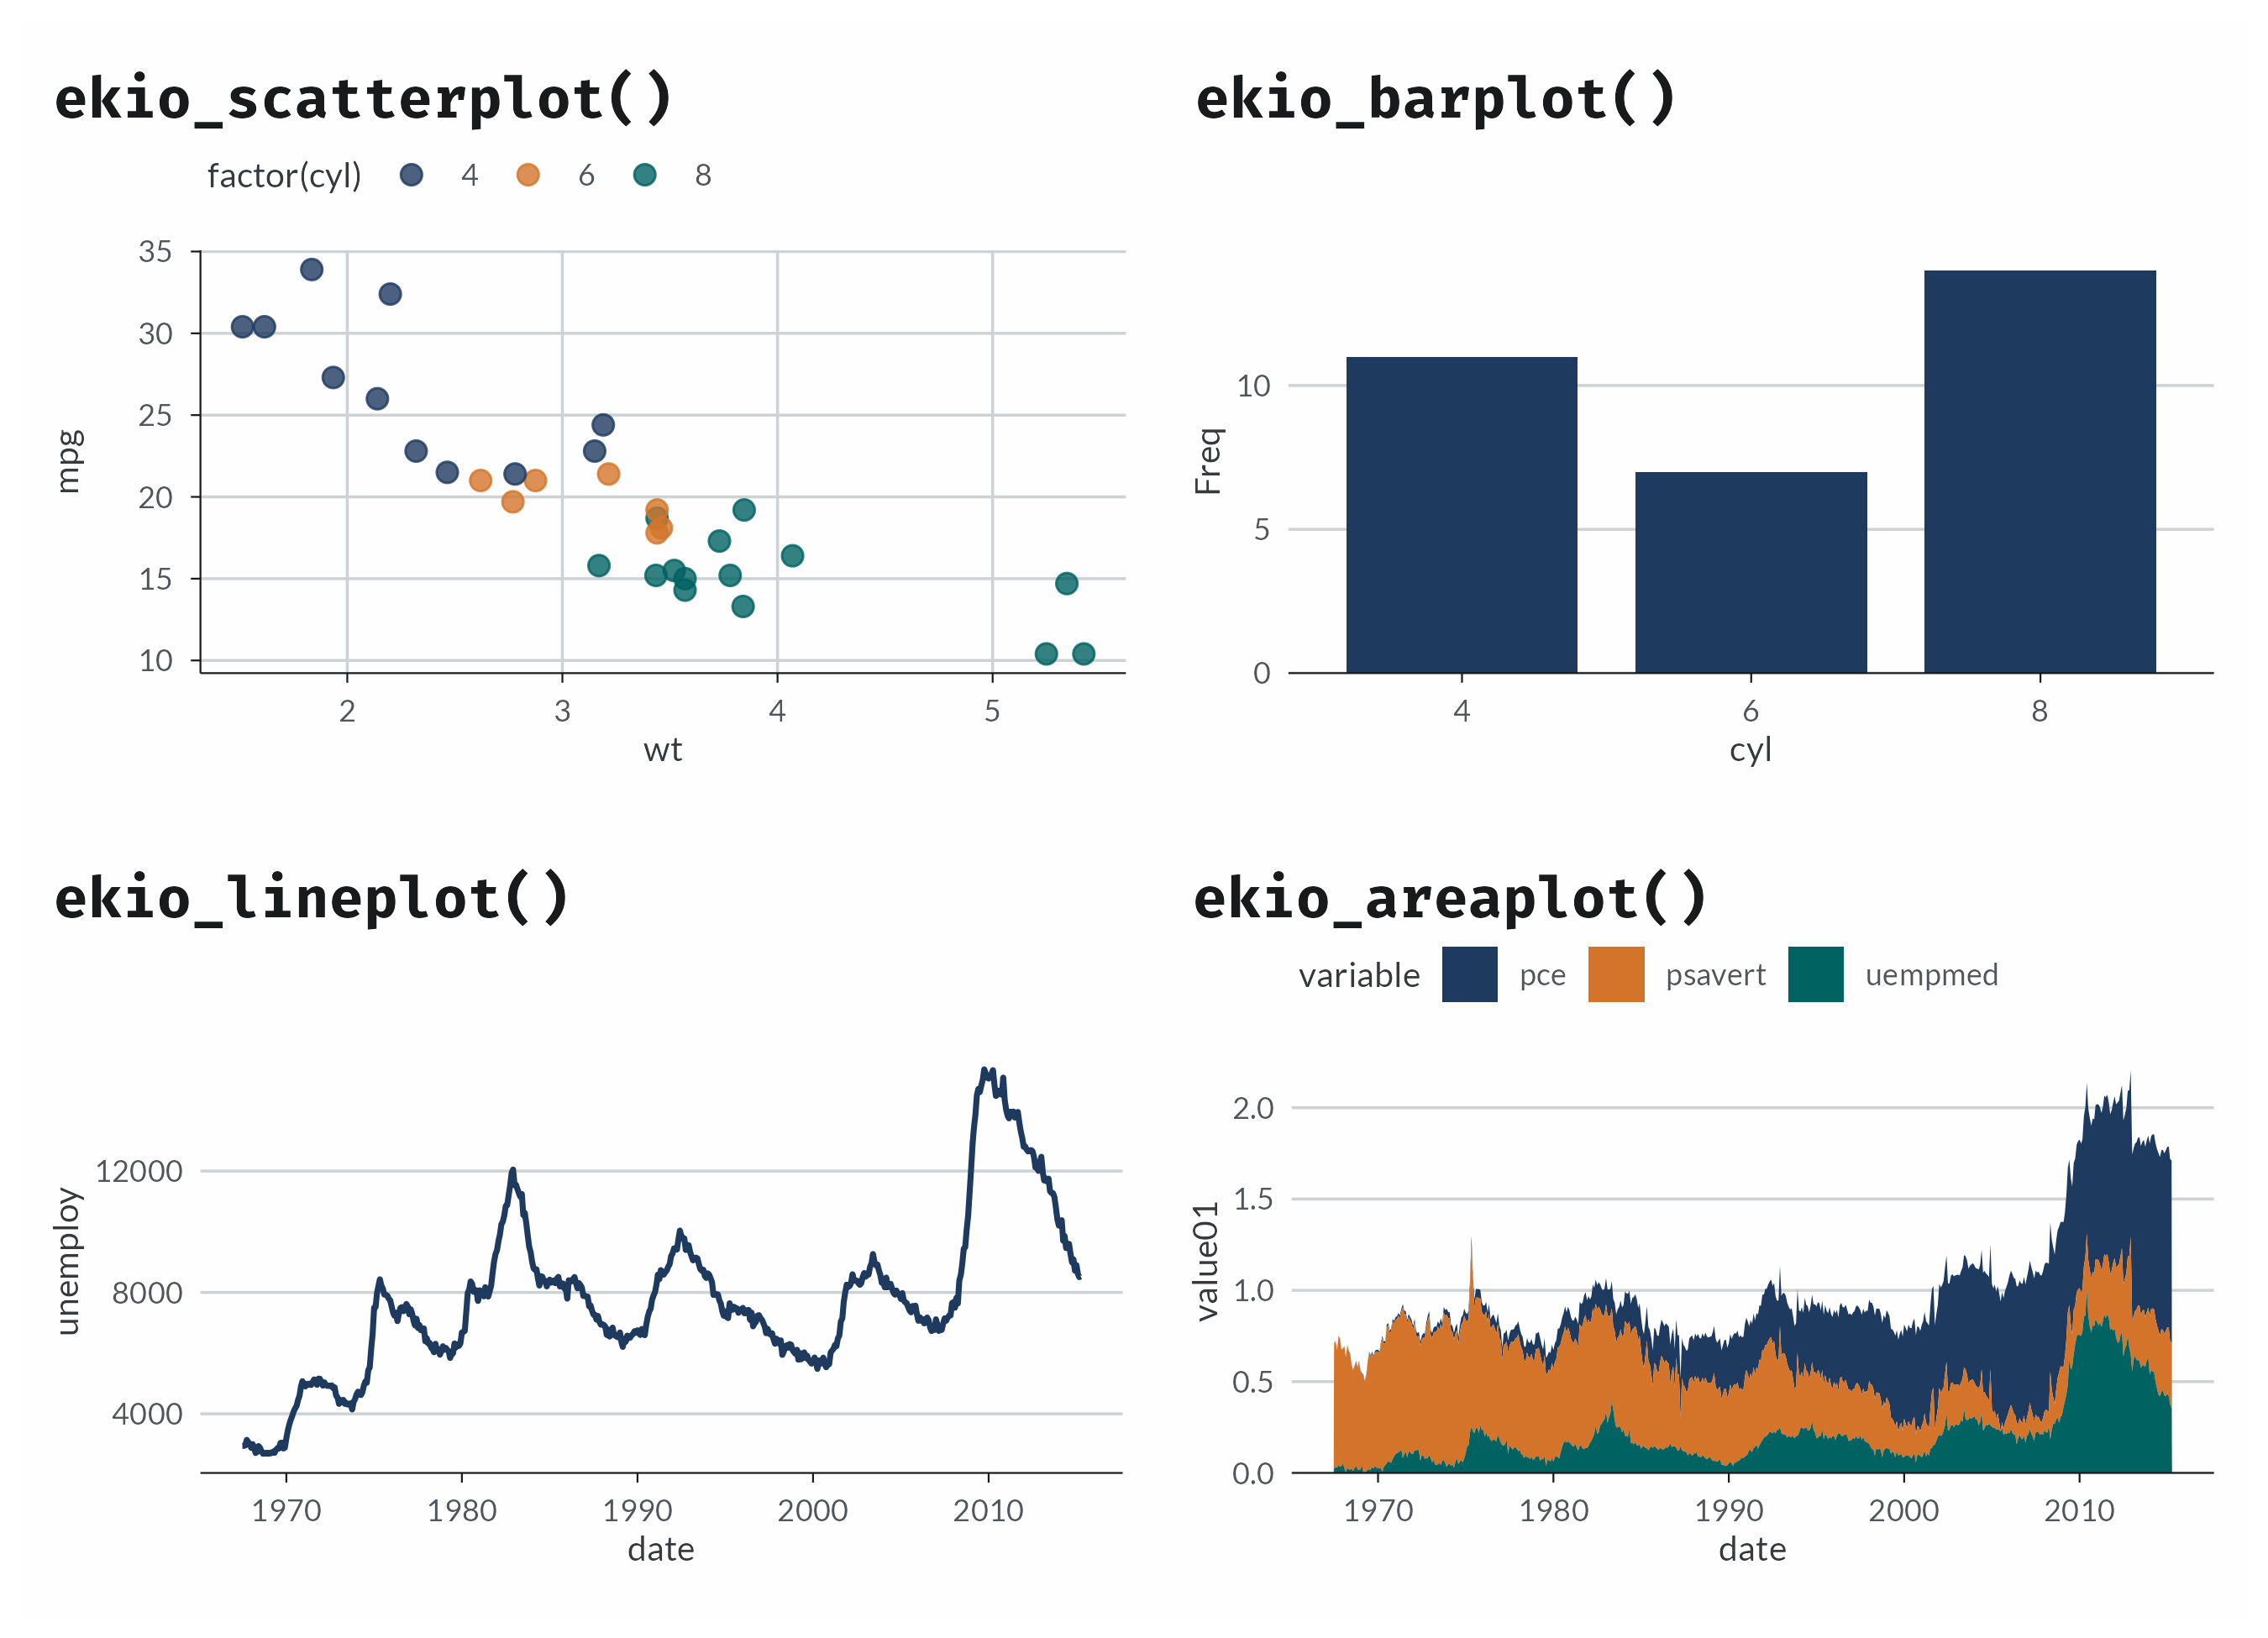
See more
See vignette("getting-started", package = "ekioplot"), the palette gallery, and the package website at https://viniciusoike.github.io/ekioplot/.