Title
Usage
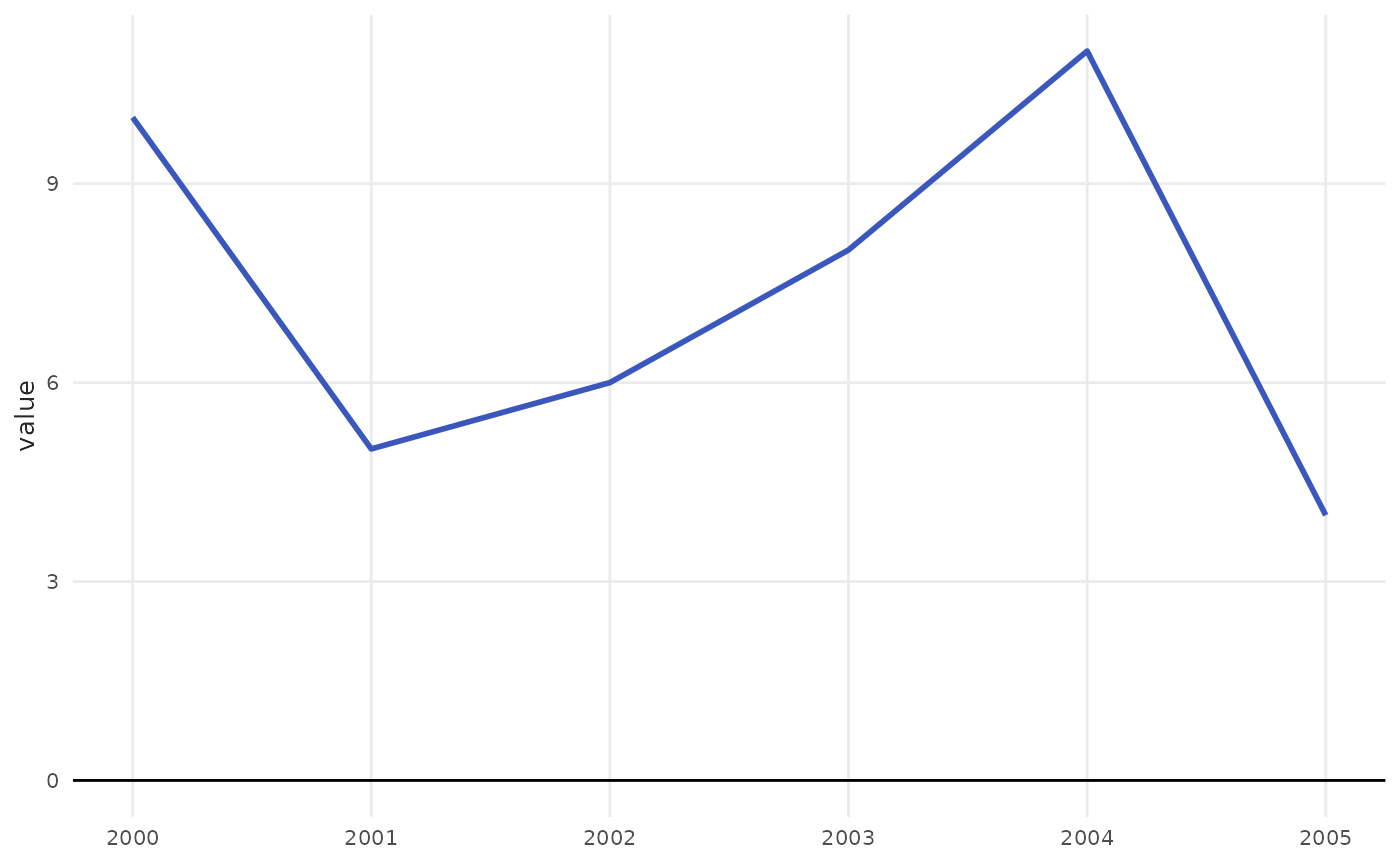
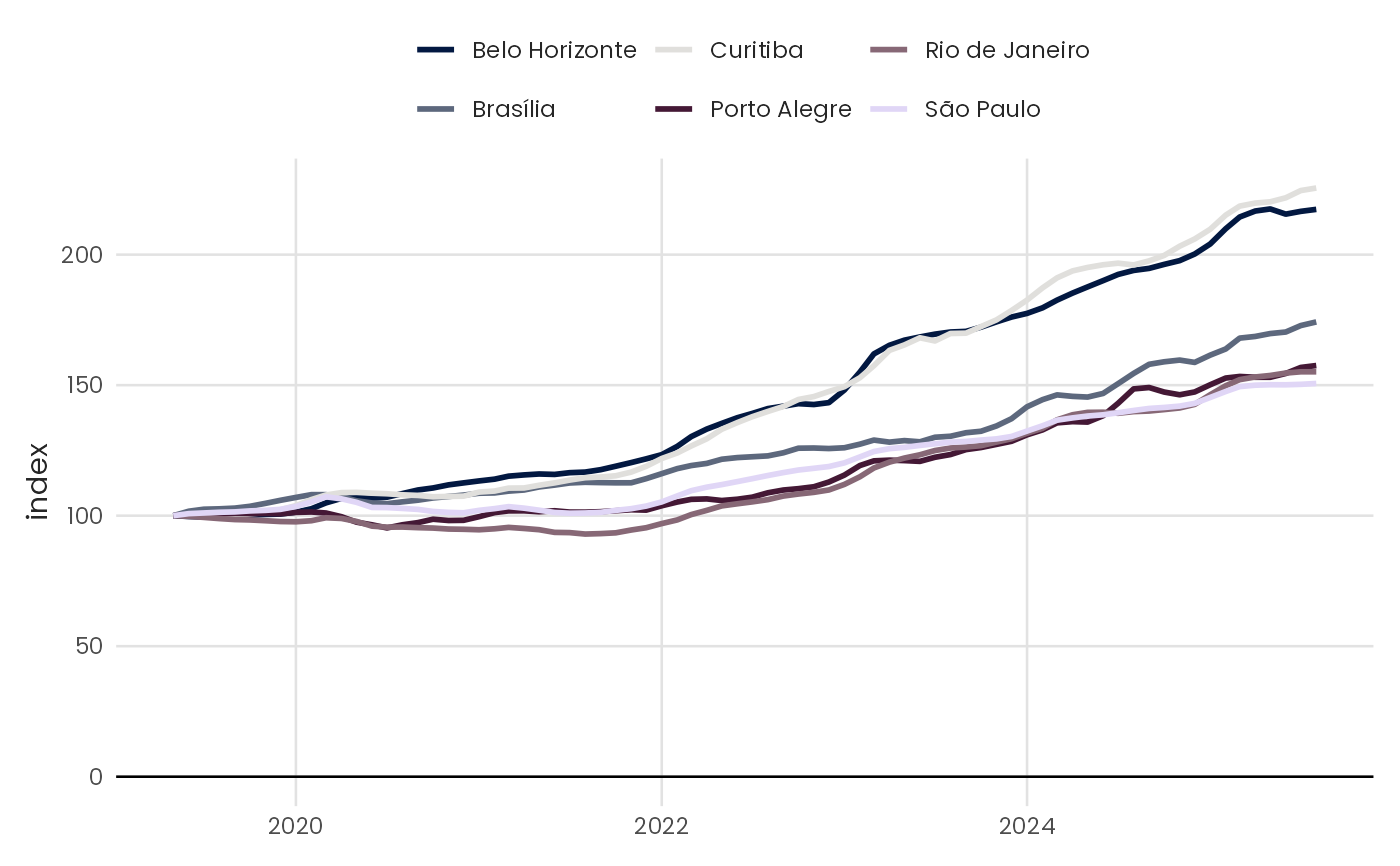
plot_line(
  data,
  x,
  y,
  color = NULL,
  zero = TRUE,
  point = FALSE,
  pal_name,
  scale_name = "",
  scale_label = ggplot2::waiver(),
  ...
)
Arguments
- data
A data.frame type object.
- x
<
data-masked> Variable to be mapped on the x-axis.- y
<
data-masked> Variable to be mapped on the y-axis.- color
Color of the line. Either a color string (e.g.,
"blue","#021841") for a single static color, or a bare column name (without quotes) to map a grouping variable to color.- zero
Logical indicating if a horizontal line (y = 0) should be drawn on the plot.
- point
Logical indicating if points should be drawn on top of line.
- pal_name
String indicating which color palette to use.
- scale_name
String indicating color legend title.
- scale_label
String indicating color legend labels.
- ...
Other arguments to ggplot2 function.