Plot a column chart
Usage
plot_column(
  data,
  x,
  y,
  fill = NULL,
  zero = TRUE,
  text = FALSE,
  text_inside = FALSE,
  text_place = NULL,
  text_padding = NULL,
  pal_name = "qual_benvi",
  scale_name = "",
  scale_label = ggplot2::waiver(),
  digits = 0,
  percent = FALSE,
  text_color = "gray20",
  text_family = getOption("theme_benvi.font_family", "sans"),
  text_size = 3,
  position_col = "stack",
  position_text = position_col,
  ...
)
Arguments
- data
A data.frame type object
- x
<
data-masked> Variable to be mapped in the x-axis.- y
<
data-masked> Variable to be mapped in the y-axis.- fill
Fill color for the columns. Either a color string (e.g.,
"blue","#021841") for a single static color, or a bare column name (without quotes) to map a grouping variable to fill color.- zero
Logical indicating whether a horizontal line crossing the y = 0 axis should be plotted.
- text
Logical indicating if text labels should be plotted on column bars
- text_inside
Logical indicating if text labels should be placed inside bars (using ggfittext). When TRUE, text is auto-sized to fit inside bars. When FALSE (default), text appears above/beside bars at fixed size.
- text_place
Placement of inside text. One of "top", "bottom", "left", "right", "centre"/"center". Only used when text_inside = TRUE. Defaults to "centre".
- text_padding
Padding around inside text as grid::unit(). Only used when text_inside = TRUE. Defaults to 1mm.
- pal_name
String indicating the name of which palette to use.
- scale_name
String indicating fill legend title.
- scale_label
String indicating fill legend labels.
- digits
Number of digits to show in text labels.
- percent
Logical indicating if a % should be appended to text labels
- text_color
Color of the text label. Default is
"gray20".- text_family
Font of the text label. Defaults to
getOption("theme_benvi.font_family", "sans").- text_size
Size of the text label. Default is
3.- position_col
Argument passed on to
positioningeom_col.- position_text
Argument passed on to
positioningeom_text.- ...
Further arguments for
geom_text
Examples
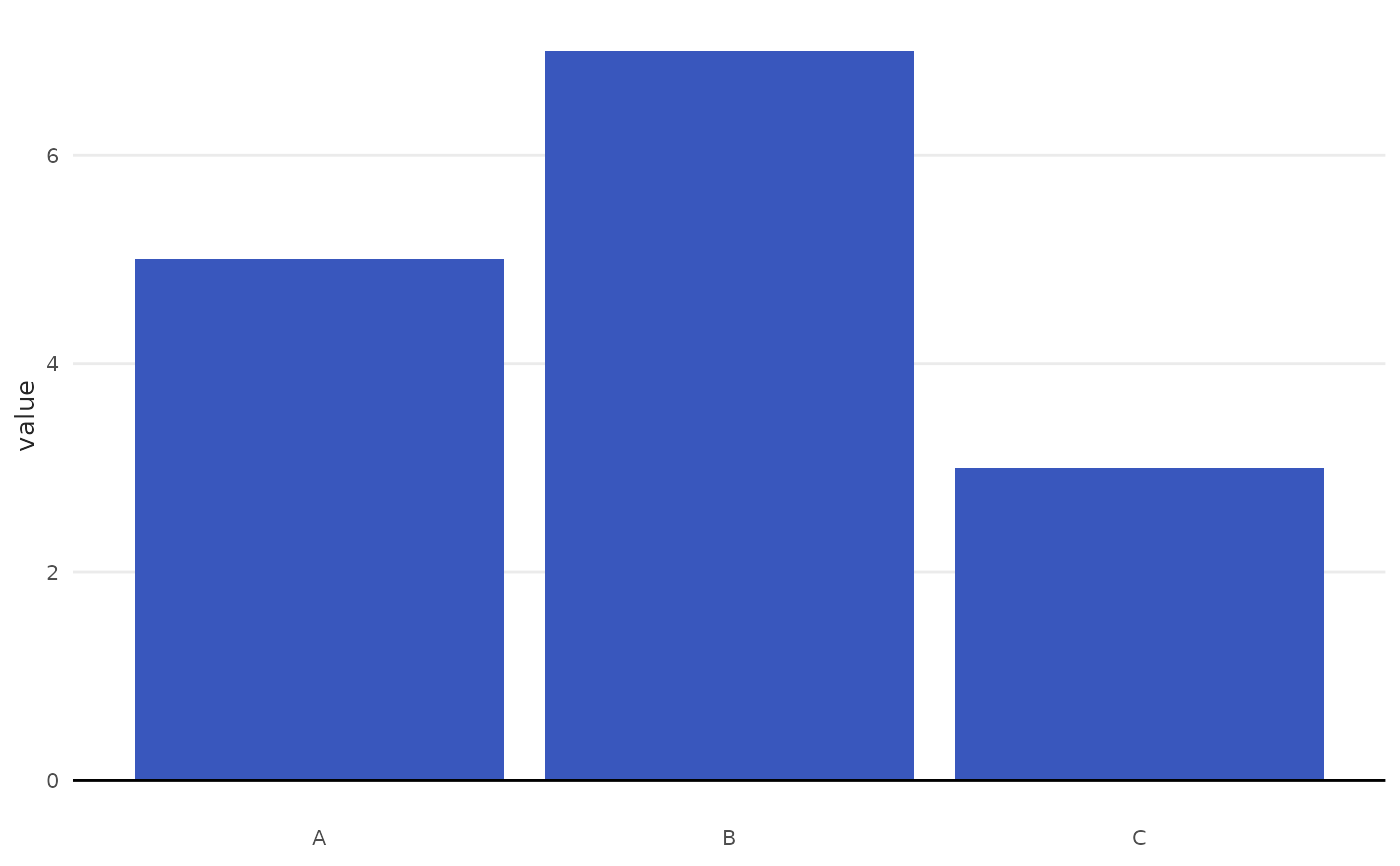
# Column chart by city at the latest date
latest <- subset(iqa, date == max(iqa$date))
plot_column(data = latest, x = name_muni, y = index)
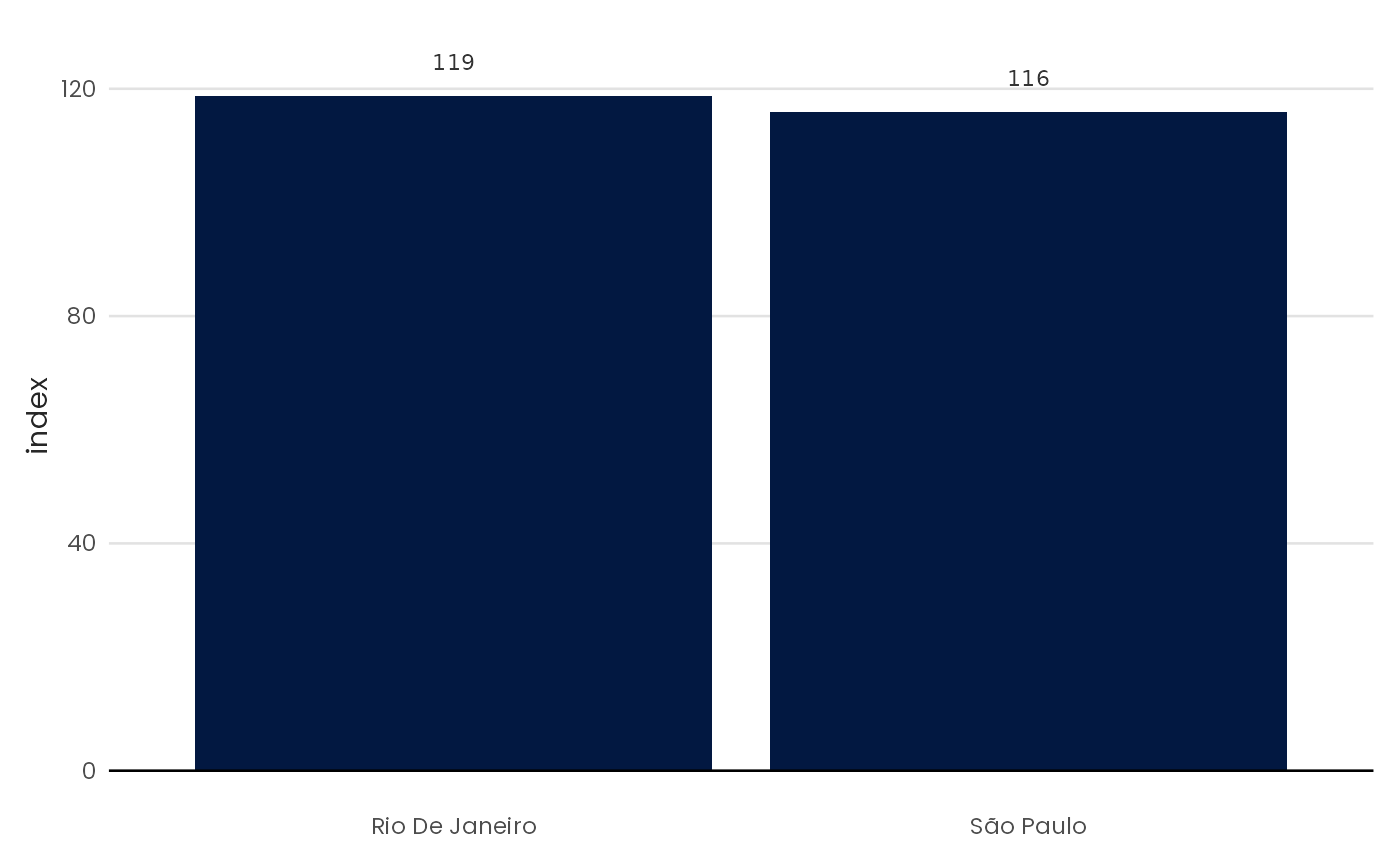
 # With text labels above bars
plot_column(data = latest, x = name_muni, y = index, text = TRUE)
# With text labels above bars
plot_column(data = latest, x = name_muni, y = index, text = TRUE)
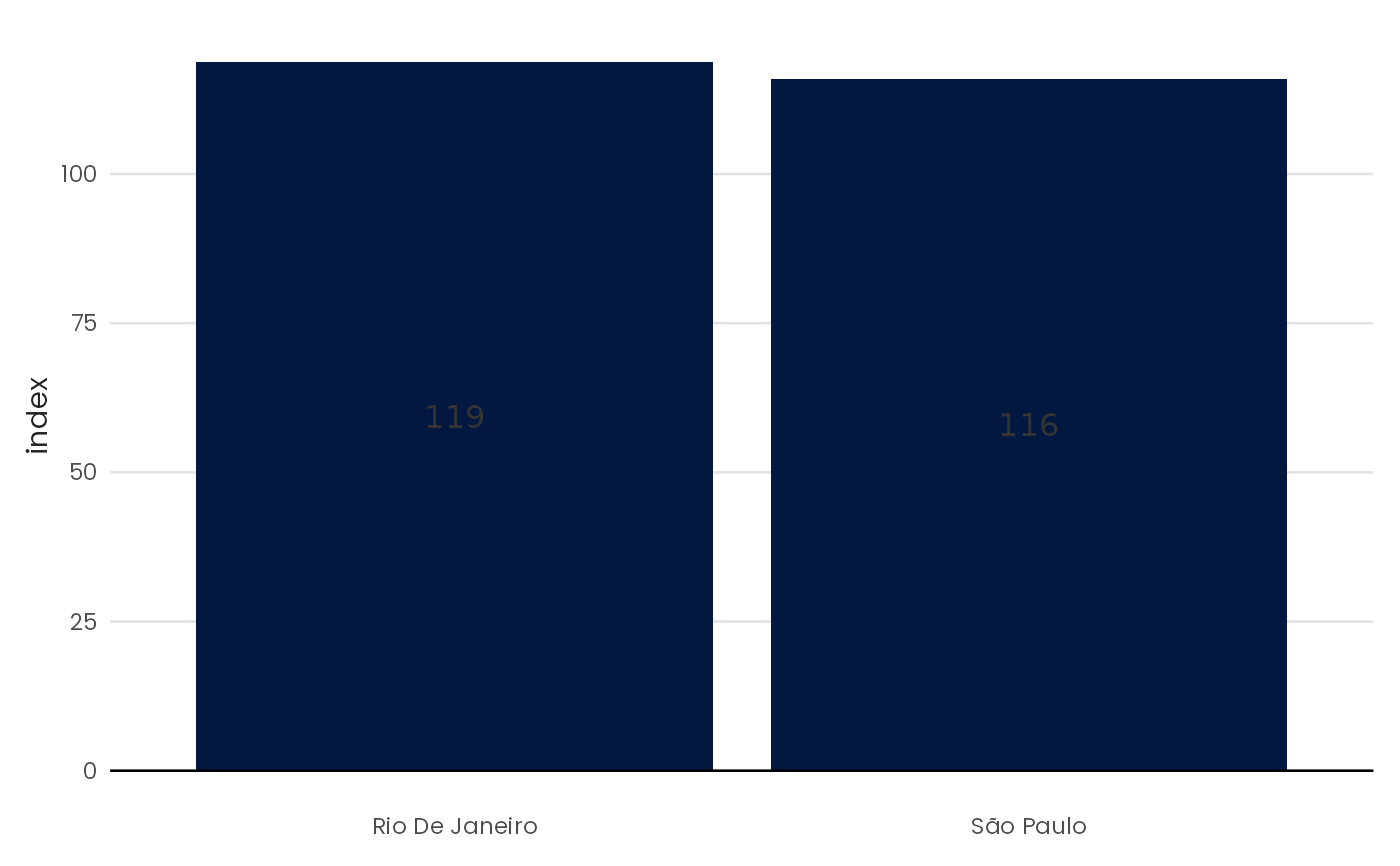
 # With text labels inside bars
latest <- subset(iqa, date == max(iqa$date))
plot_column(data = latest, x = name_muni, y = index, text = TRUE, text_inside = TRUE)
# With text labels inside bars
latest <- subset(iqa, date == max(iqa$date))
plot_column(data = latest, x = name_muni, y = index, text = TRUE, text_inside = TRUE)