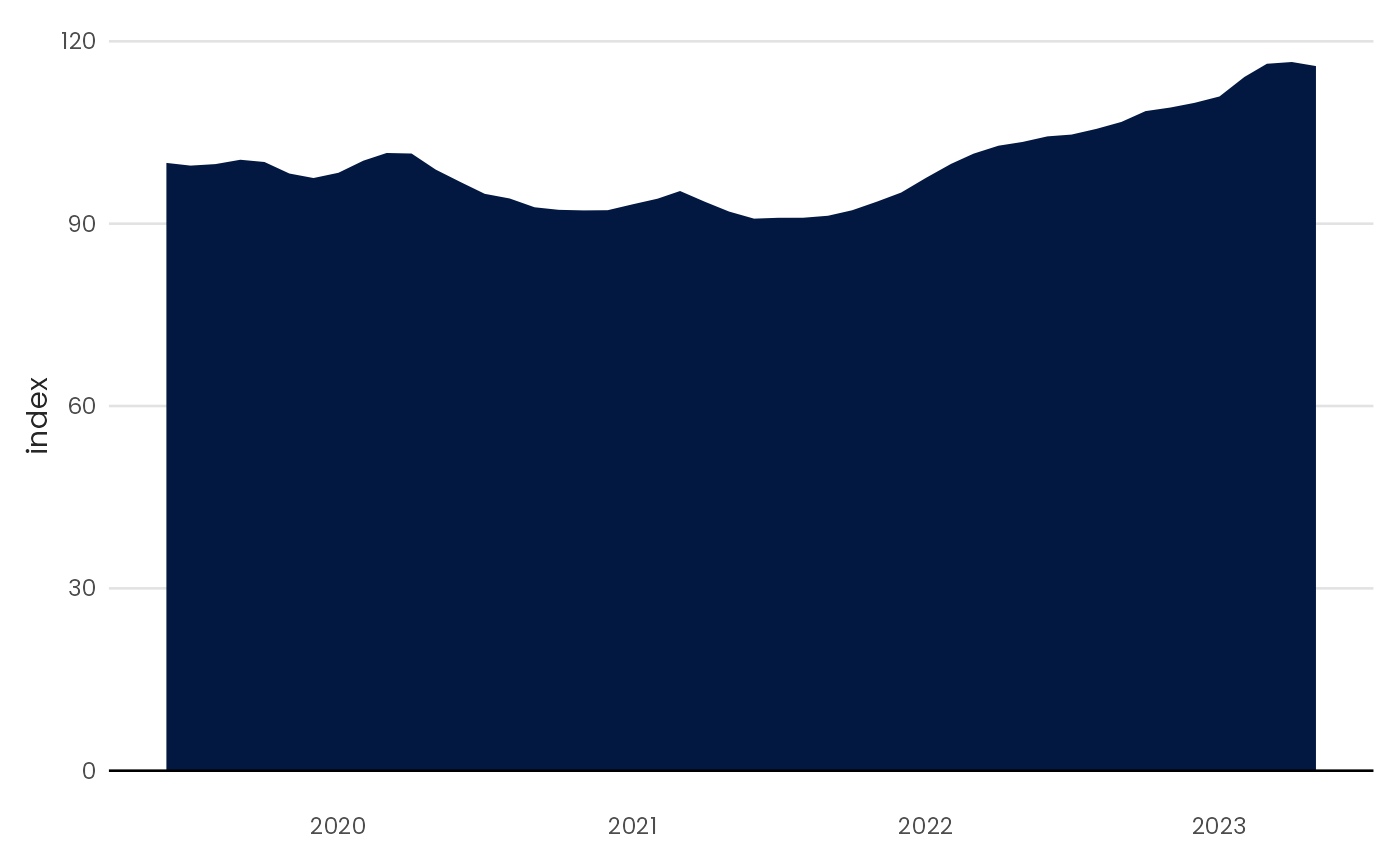
Plot an area chart
Arguments
- data
A data.frame type object
- x
<
data-masked> Variable to be mapped in the x-axis.- y
<
data-masked> Variable to be mapped in the y-axis.- fill
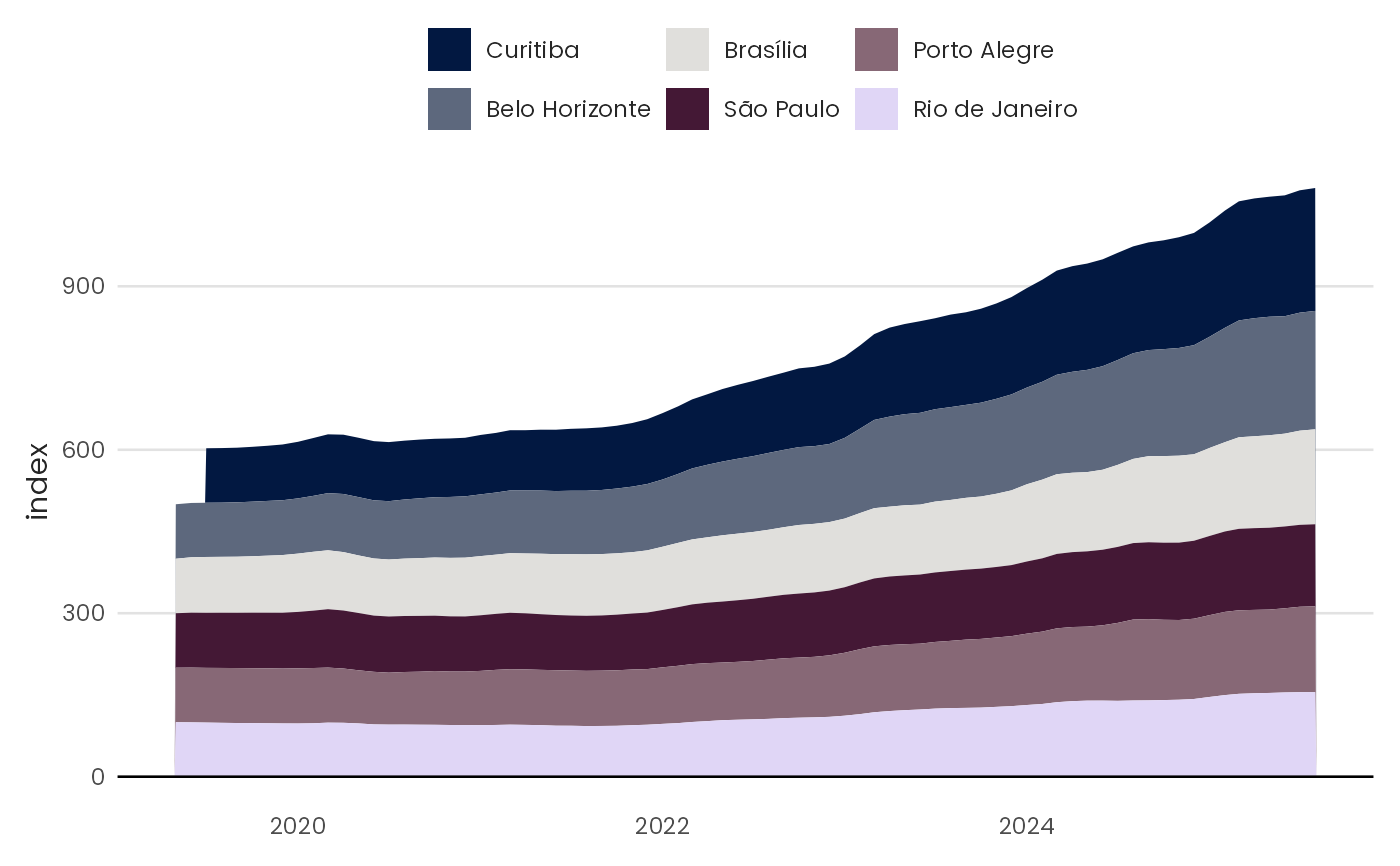
Fill color for the area. Either a color string (e.g.,
"blue","#021841") for a single static color, or a bare column name (without quotes) to map a grouping variable to fill color.- zero
Logical indicating whether a horizontal line crossing the y = 0 axis should be plotted.
- order
Logical indicating if the stacked areas should be ordered. Default behavior (
TRUE) stacks the largest groups on top.- pal_name
String indicating the name of which palette to use.
- scale_name
String indicating fill legend title.
- scale_label
String indicating fill legend labels.
- text
Logical indicating if text labels should be plotted on column bars
- text_color
Color of the text label. Default is
"gray20".- text_family
Font of the text label. Defaults to
getOption("theme_benvi.font_family", "sans").- text_size
Size of the text label. Default is
3.- position
Argument passed to
geom_area.- position_text
Argument passed on to
positioningeom_text.