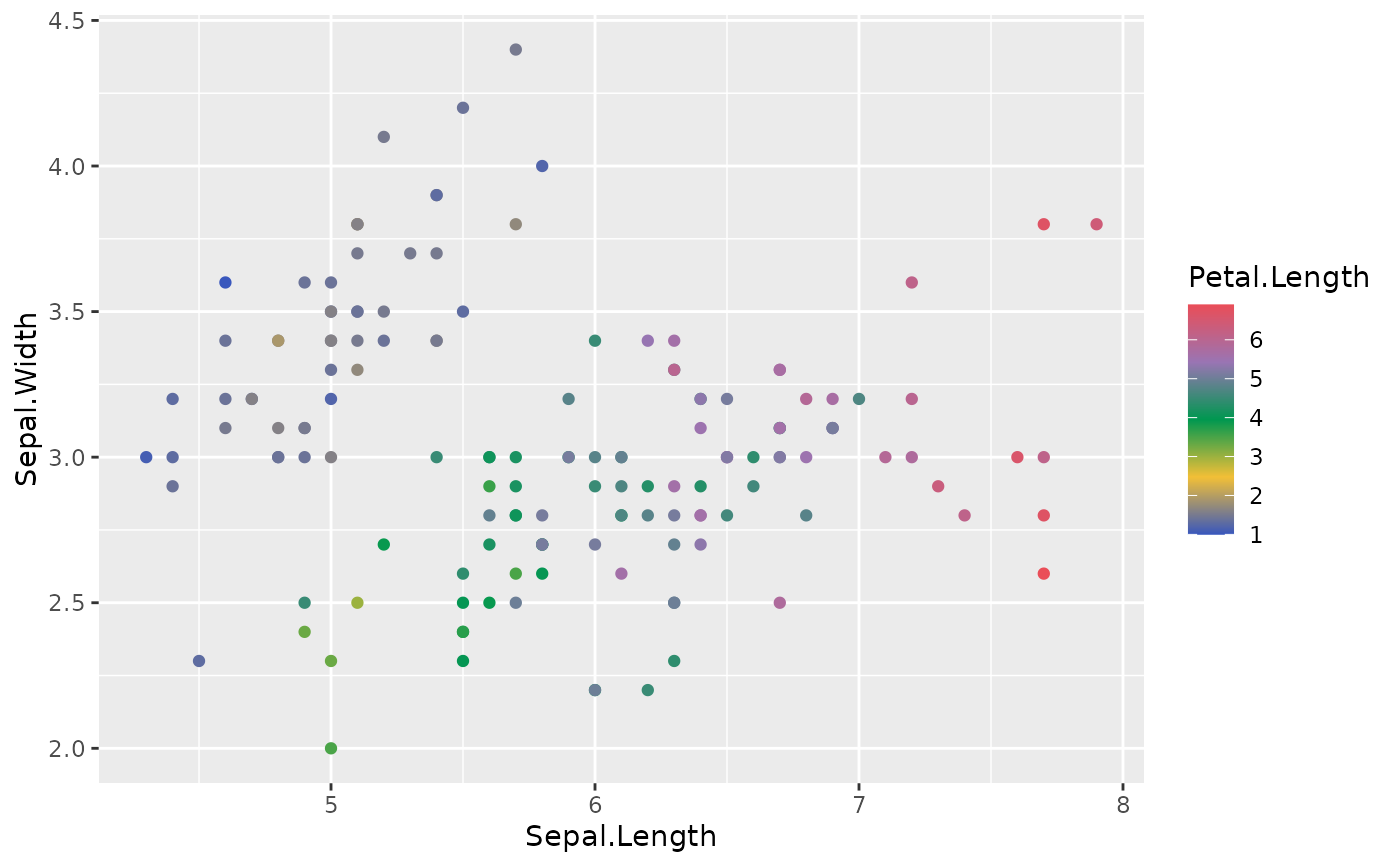
Map continuous values to colors interpolated from a Benvi palette.
Usage
scale_colour_benvi_c(pal_name = "benvi_blue", direction = 1, ...)

scale_color_benvi_c(pal_name = "benvi_blue", direction = 1, ...)

scale_fill_benvi_c(pal_name = "benvi_blue", direction = 1, ...)
Arguments
- pal_name
Name of the palette. Defaults to
"benvi_blue".- direction
Either
1or-1. Use-1to reverse the palette.- ...
Additional arguments passed to
ggplot2::scale_colour_gradientn()orggplot2::scale_fill_gradientn().
Examples
library(ggplot2)

ggplot(mtcars, aes(x = wt, y = mpg, color = hp)) +
  geom_point() +
  scale_color_benvi_c("benvi_blue")