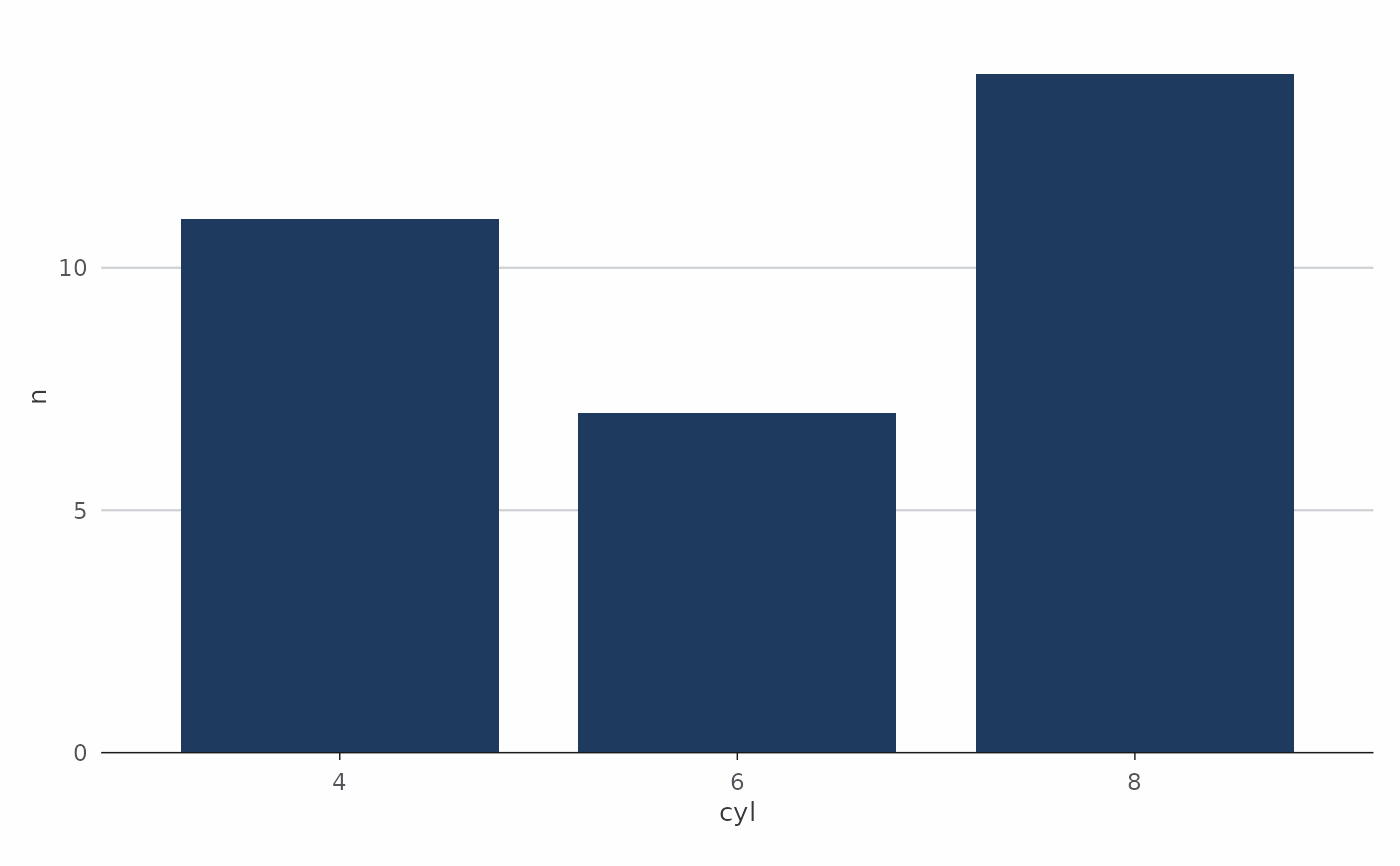
Professional bar plot with smart aesthetic detection.
Usage
ekio_barplot(
  data,
  x,
  y,
  fill = NULL,
  palette = NULL,
  horizontal = FALSE,
  bar_width = 0.8,
  title = NULL,
  subtitle = NULL,
  caption = NULL,
  ...
)
Arguments
- data
A data frame
- x
X-axis variable (supports data-masking)
- y
Y-axis variable (supports data-masking)
- fill
Fill aesthetic. A color string or a discrete variable. A continuous variable is an error: bin it or wrap it in
factor().- palette
Character. Palette name for variable mappings.
- horizontal
Logical. Create horizontal bar plot (default: FALSE)
- bar_width
Bar width (default: 0.8)
- title, subtitle, caption
Plot labels. NULL (default) draws none.
- ...
Additional arguments passed to
ggplot2::geom_col(). These override the recipe's own geom defaults.
Examples
cyl_counts <- as.data.frame(table(cyl = mtcars$cyl))
names(cyl_counts)[2] <- "n"
ekio_barplot(cyl_counts, cyl, n)