# Latest published data, downloaded once and cached afterwards
entrance <- read_metro_demand("line_entries_monthly")

# A monthly batch, so an analysis can name the vintage it used
entrance_sep <- read_metro_demand("line_entries_monthly", vintage = "2026-09")

# The bundled snapshot, with no network access
entrance_bundled <- read_metro_demand("line_entries_monthly", source = "bundled")This article describes the datasets shipped with metrosp in detail. It covers where each number comes from, how far each line reaches in time, and which defects survive from the sources. For column names and types alone, see the Data Dictionary.
Overview
The package ships four demand datasets. Two measure passengers at the line level, and two at the station level.
| Dataset | Description | Unit | Time span | Frequency | Package name |
|---|---|---|---|---|---|
| Passenger entries by line | Passenger entries, measured by the station’s turnstiles, aggregated by day-type metrics. | Passengers | 2012–2026 | Monthly | line_entries_monthly |
| Transported passengers per line | Number of transported passengers, measured by boardings plus transfers between lines at interchange stations. | Passengers | 2012–2026 | Monthly | line_transported_monthly |
| Station-level transported | Average business day passengers transported per station, aggregated by month. | Passengers | 2012–2026 | Monthly | station_transported_monthly |
| Station-level daily | Daily passenger entries at each station. | Passengers | 2012–2026 | Daily | station_entries_daily |
All four datasets count individual passengers. line_transported_monthly covers Line 4 from 2012 and Line 5 only through August 2018; station_transported_monthly covers Line 5 only through July 2018.
A “passenger entry” (entrada de passageiros) is a passenger who crossed the station’s turnstile gates (linha de bloqueios). A “transported passenger” (passageiro transportado) is one who boarded a train on that line, whether through a turnstile or by transferring from another line at an interchange station, so transported counts are always equal to or greater than entry counts. No clean network total exists across operators: METRO line entries include transfers arriving from Lines 4 and 5, while Lines 4 and 5 count turnstiles only.
The table simplifies in two ways. First, the time span varies by line; each dataset section below gives the window per line. Second, the producer changes over time: METRO ran Line 5 at first and later handed it to ViaMobilidade.
Data vintage
The bundled datasets are a fixed snapshot, current through July 2026. The snapshot moves when the column schema changes or when a release deliberately carries new data, not when new months are published upstream, so results computed from a given package version stay reproducible. METRO publishes irregularly and revises past years, so the bundled figures drift from the source over time.
read_metro_demand() reads the published data instead. Every pipeline run writes a fresh build to the rolling data-latest GitHub release and to a dated tag for that month. A later run in the same month replaces the dated batch, so a monthly vintage is revisable rather than an exact pin; read_metro_demand() re-checks its manifest every few hours and downloads only the assets that changed.
Downloads use the platform-specific user cache returned by tools::R_user_dir(). metrosp_cache() shows what is on disk and metrosp_cache_clear() removes package-managed vintage directories without deleting unrelated files; set cache = FALSE to keep a download only for the current session. Columns are identical across sources, so the definitions below hold for both.
Only the four demand datasets are published separately. The reference datasets do not change with new months, so read them from the package.
Data producers
This package aggregates and harmonizes data from three different data producers: 1) the METRO transparency website; 2) Insper’s Dataverse; and 3) São Paulo’s public geodata repository, GeoSampa.
I use the term data producer rather than source to emphasize the processing this package ships: combining these datasets takes a lot of cleaning. The targets package orchestrates the full pipeline, which lives in the package’s GitHub repository.
| Dataset | Granularity | Producer | Time span | Line Coverage |
|---|---|---|---|---|
line_entries_monthly |
line month metric | METRO + Dataverse | 2012–2026 | All |
line_transported_monthly |
line month metric | METRO + Dataverse | 2012–2026 | Lines 1, 2, 3, 4, 5, and 15 |
station_transported_monthly |
station month | METRO + Dataverse | 2012–2026 | Lines 1, 2, 3, 4, 5 (to Jul 2018), and 15 |
station_entries_daily |
station day | METRO + Dataverse | 2012–2026 | All |
rail_lines |
line (spatial) | GeoSampa | Last updated: 2026/04/10 | All |
rail_stations |
station (spatial) | GeoSampa | Last updated: 2026/04/10 | All |
METRO SP transparency portal
The Companhia do Metropolitano de São Paulo (a.k.a. METRÔ) publishes monthly demand reports at its data transparency portal. Reports cover Lines 1 (Azul/Blue), 2 (Verde/Green), 3 (Vermelha/Red), 5 (Lilás/Lilac, until Jul 2018), and 15 (Prata/Silver), and are available from January 2016 onward. Values are reported in thousands (milhares).
Before 2020, these monthly reports were published as monthly PDF and csv files. The csv files start in October 2017; the first nine months of 2017 exist only as PDFs and were transcribed by hand for this package (see 2017 source formats). Each individual file contains a table (metric) from a specific year-month. There were three pieces of information available for each month: 1) the average number of transported passengers in each station, on business days (station_transported_monthly); 2) the number of passenger entries per line (line_entries_monthly); and 3) the number of transported passengers per line (line_transported_monthly).
From 2020 onwards, the monthly reports started to be published in annual PDF and csv files that are updated monthly. Also, a new report was published that contained the daily number of entrances per station (station_entries_daily).
Both the PDF and csv files are poorly structured, which is part of why metrosp exists. The data is public but hard to use: the format, encoding, and layout of the csv files shift from release to release, so each year and report needs its own import strategy. That fragility has produced processing errors in the past. The pipeline now runs a set of checks on every build, but errors may still slip through — if you find one, please open an issue on the GitHub repository.
Going back to the datasets, it’s important to note that each monthly passenger report breaks demand into five day-type metrics: total (monthly aggregate), average on business days, average on Saturdays, average on Sundays, and daily peak (maximum within the month). These are aggregated by METRO.
Daily station-level data (one row per station per day) is available from 2020 onwards. It counts turnstile entries plus transfers arriving from other operators, such as CPTM, Line 4, and Line 5. It excludes transfers between METRO lines, such as Lines 1 and 2 at Paraíso.
Finally, METRO produces data for lines 1, 2, 3, 5, and 15. Line 5 was initially operated by METRO SP and later passed on to ViaMobilidade (see below).
Insper Dataverse
Lines 4 (Amarela/Yellow, operated by ViaQuatro) and 5 (Lilás/Lilac, operated by ViaMobilidade from August 2018) are not published on the METRO portal. Ridership data for these lines comes from the Insper Dataverse, starting January 2012 (Line 4) and August 2018 (Line 5). The Dataverse feed records two boarding types: Bloqueio (turnstile) and Integracao (transfer). Only Line 4 records transfers, so line-level transported counts exist for Line 4 but not for Line 5 after the handover.
Unlike the METRO data, Dataverse counts are not rounded to the nearest thousand. The ETL therefore multiplies METRO values by 1,000, so every dataset reports individual passengers.
The station_transported_monthly dataset for Line 4 averages daily Bloqueio and Integracao counts on business days, using the bizdays package with the “Brazil/ANBIMA” calendar, which tracks days when the B3 stock exchange operates in São Paulo. That calendar closely mirrors the city’s business-day schedule, with one caveat: since 2022 B3 closes only for national holidays, not for municipal or state ones such as the 9th of July. The package ships calendar_spo, a São Paulo calendar that does mark those holidays, for analyses that need the finer distinction. Line 5’s Dataverse feed records turnstiles only, so its post-handover rows are dropped from the transported station table; they remain in station_entries_daily.
República appears on Lines 3 and 4 in station_transported_monthly, but only on Line 3 in station_entries_daily. The Line 4 daily feed does not publish the station; this is a source coverage gap, not a station-name mismatch.
GeoSampa
Spatial geometries for metro and commuter train (CPTM) lines and stations come from GeoSampa, the City of São Paulo’s open geospatial platform. The data includes both currently operating infrastructure and planned future expansions.
Core datasets
Each section below shows the structure of one dataset and its coverage by line. The Data Dictionary defines every column and type.
line_entries_monthly
This table shows the number of monthly passenger entries aggregated by metro line and day-type metrics.
dplyr::glimpse(line_entries_monthly)
#> Rows: 3,990
#> Columns: 9
#> $ date           <date> 2012-01-01, 2012-01-01, 2012-01-01, 2012-01-01, 2012-0…
#> $ year           <int> 2012, 2012, 2012, 2012, 2012, 2012, 2012, 2012, 2012, 2…
#> $ line_number    <int> 4, 4, 4, 4, 4, 4, 4, 4, 4, 4, 4, 4, 4, 4, 4, 4, 4, 4, 4…
#> $ line_name      <chr> "Yellow", "Yellow", "Yellow", "Yellow", "Yellow", "Yell…
#> $ line_name_pt   <chr> "Amarela", "Amarela", "Amarela", "Amarela", "Amarela", …
#> $ metric         <chr> "max", "mdo", "mdu", "msa", "total", "max", "mdo", "mdu…
#> $ metric_name    <chr> "Daily Peak", "Average on Sundays", "Average on Busines…
#> $ metric_name_pt <chr> "Máxima Diária", "Média dos Domingos", "Média dos Dias …
#> $ value          <dbl> 122637.00, 24663.40, 99339.64, 48876.25, 2504294.00, 13…
This table is organized by day-type metrics that are defined below.
Metrics
| Code | English | Portuguese |
|---|---|---|
total |
Total passengers in the month | Total |
mdu |
Average on business days | Média dos Dias Úteis |
msa |
Average on Saturdays | Média dos Sábados |
mdo |
Average on Sundays | Média dos Domingos |
max |
Daily peak | Máxima Diária |
Time coverage by line
The time coverage of this dataset varies by line. End dates below are those of the shipped snapshot, not of the upstream source.
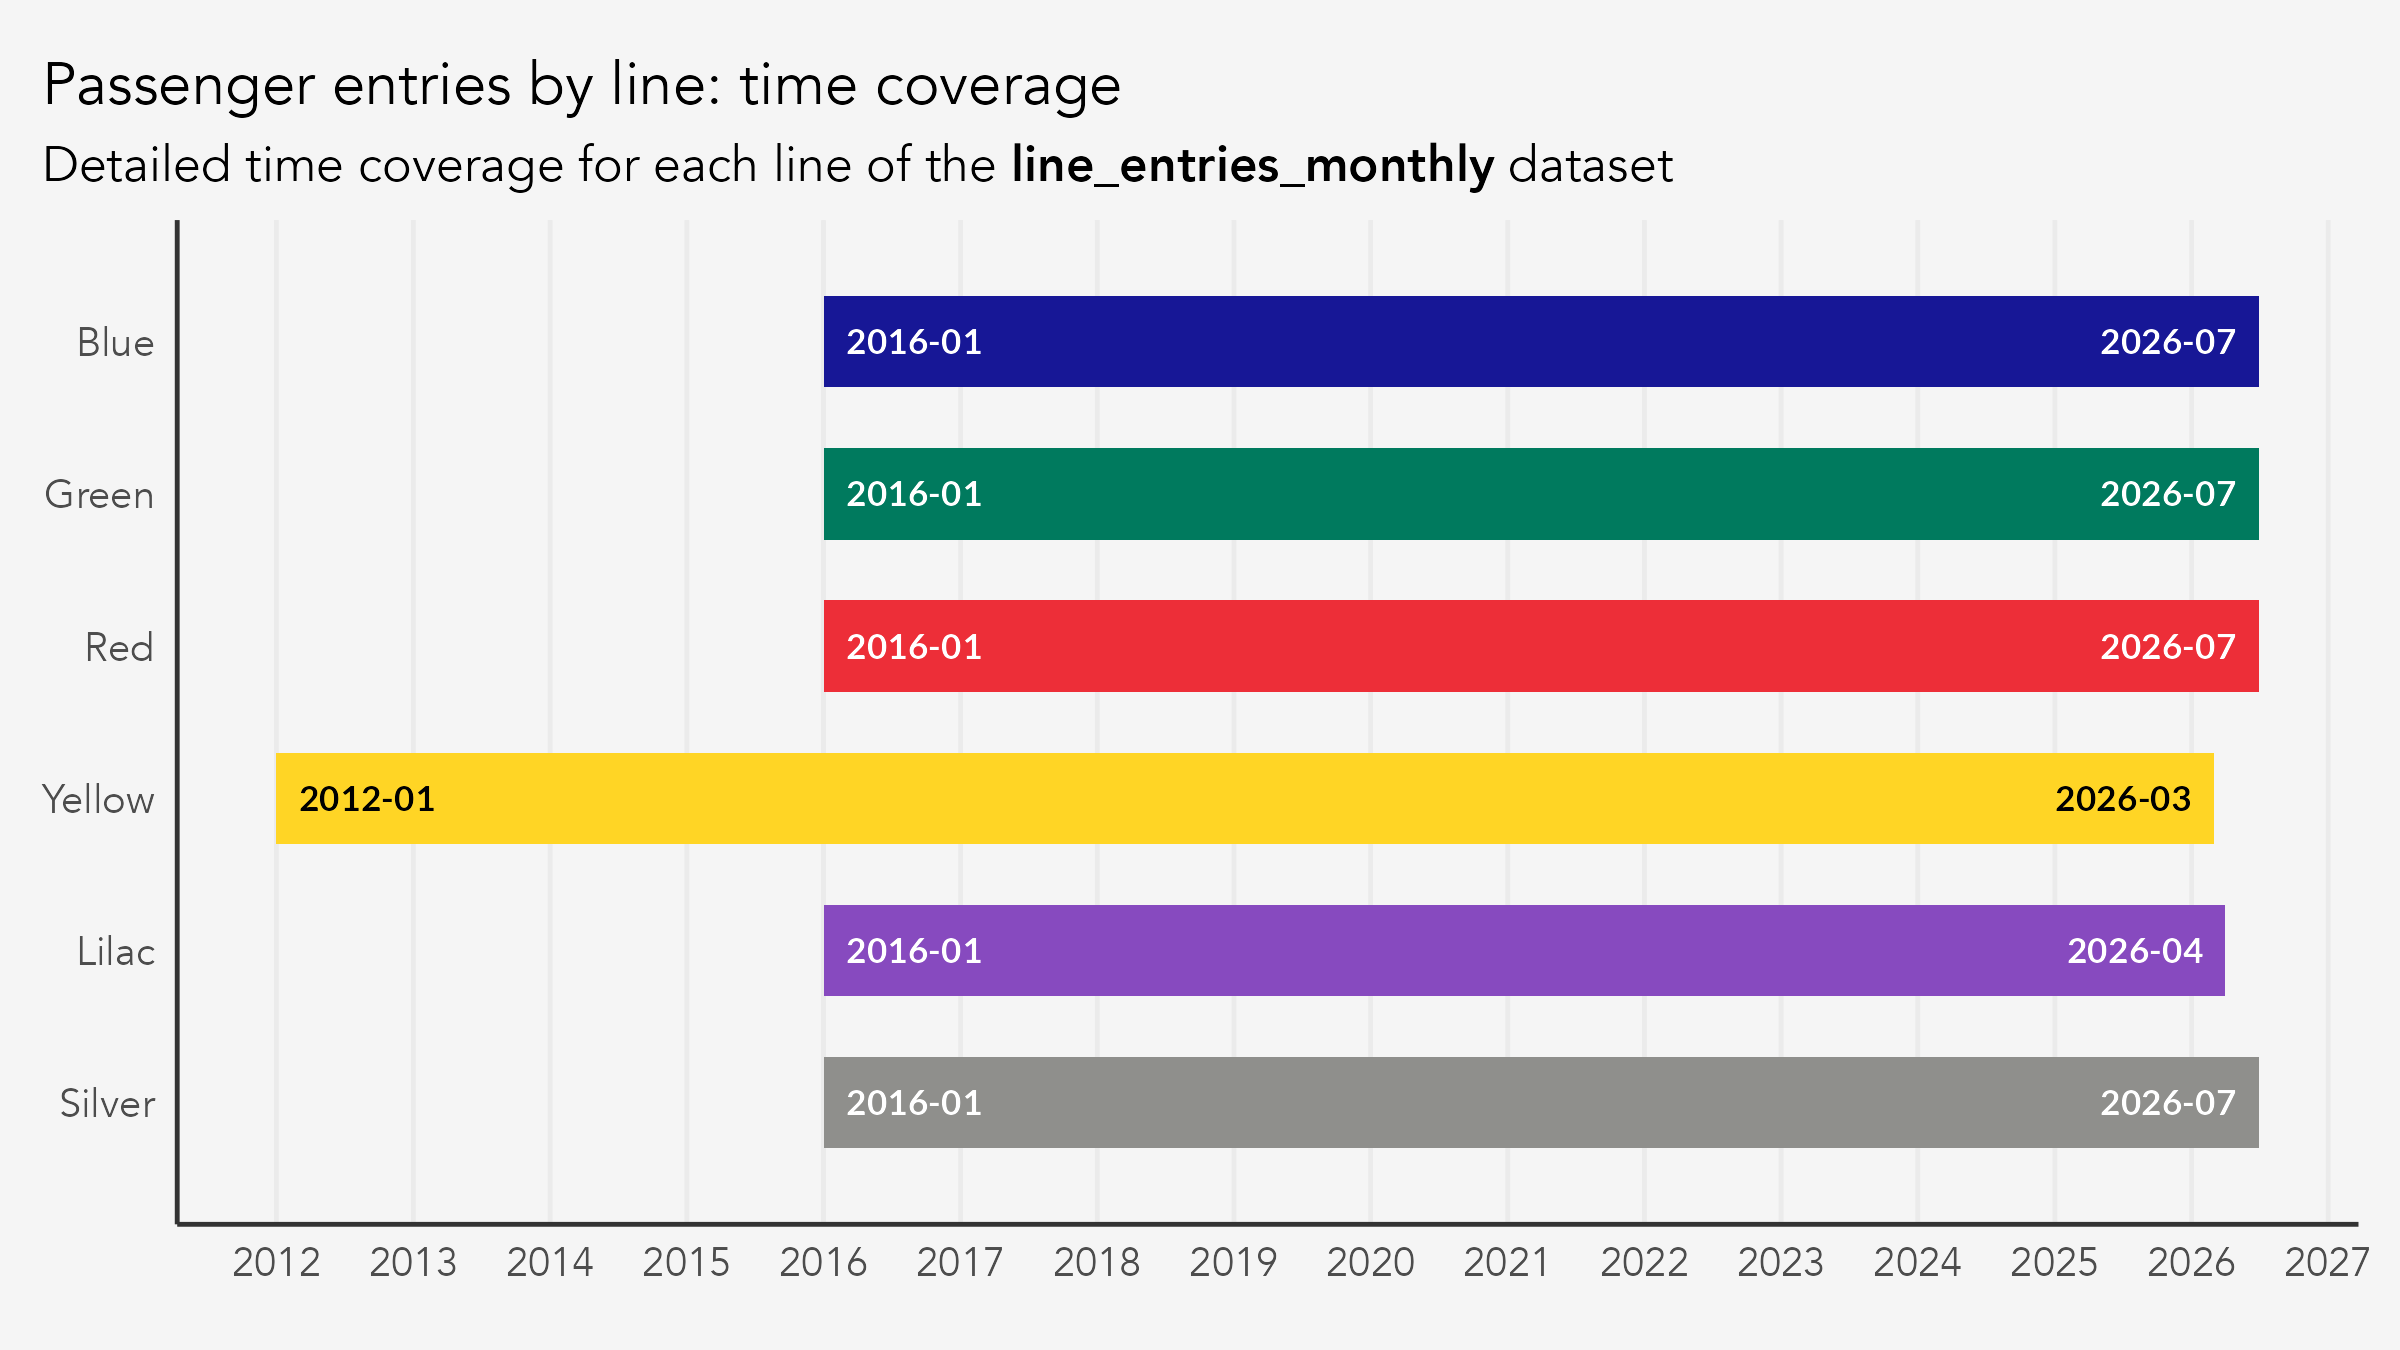
| Line | Source | From | To |
|---|---|---|---|
| 1 – Blue | METRO portal | Jan 2016 | Jul 2026 |
| 2 – Green | METRO portal | Jan 2016 | Jul 2026 |
| 3 – Red | METRO portal | Jan 2016 | Jul 2026 |
| 4 – Yellow | Dataverse | Jan 2012 | Mar 2026 |
| 5 – Lilac | METRO (Jan 2016–Jul 2018), Dataverse (Aug 2018+) | Jan 2016 | Apr 2026 |
| 15 – Silver | METRO portal | Jan 2016 | Jul 2026 |
The Dataverse source lags METRO, so Lines 4 and 5 end earlier than the rest. Every METRO-sourced line is missing July 2017, the one month the portal never published an entrance table for (see 2017 source formats).
line_transported_monthly
This table shows the number of monthly passengers transported, aggregated by metro line and day-type metric. It counts passengers boarding a train on that line, whether through the turnstile gates or by transferring from another line. METRO publishes it in thousands; the package multiplies by 1000, so values count individual passengers like every other dataset. Line 4 comes from the Dataverse in individual passengers, summing turnstile entries and transfers.
dplyr::glimpse(line_transported_monthly)
#> Rows: 3,555
#> Columns: 9
#> $ date           <date> 2012-01-01, 2012-01-01, 2012-01-01, 2012-01-01, 2012-0…
#> $ year           <int> 2012, 2012, 2012, 2012, 2012, 2012, 2012, 2012, 2012, 2…
#> $ line_number    <int> 4, 4, 4, 4, 4, 4, 4, 4, 4, 4, 4, 4, 4, 4, 4, 4, 4, 4, 4…
#> $ line_name      <chr> "Yellow", "Yellow", "Yellow", "Yellow", "Yellow", "Yell…
#> $ line_name_pt   <chr> "Amarela", "Amarela", "Amarela", "Amarela", "Amarela", …
#> $ metric         <chr> "max", "mdo", "mdu", "msa", "total", "max", "mdo", "mdu…
#> $ metric_name    <chr> "Daily Peak", "Average on Sundays", "Average on Busines…
#> $ metric_name_pt <chr> "Máxima Diária", "Média dos Domingos", "Média dos Dias …
#> $ value          <dbl> 573606.0, 128101.0, 494526.9, 214406.5, 12377723.0, 665…
This dataset uses the same day-type metrics as line_entries_monthly (see Metrics above).
Time coverage by line
The time coverage of this dataset varies by line. End dates below are those of the shipped snapshot, not of the upstream source.
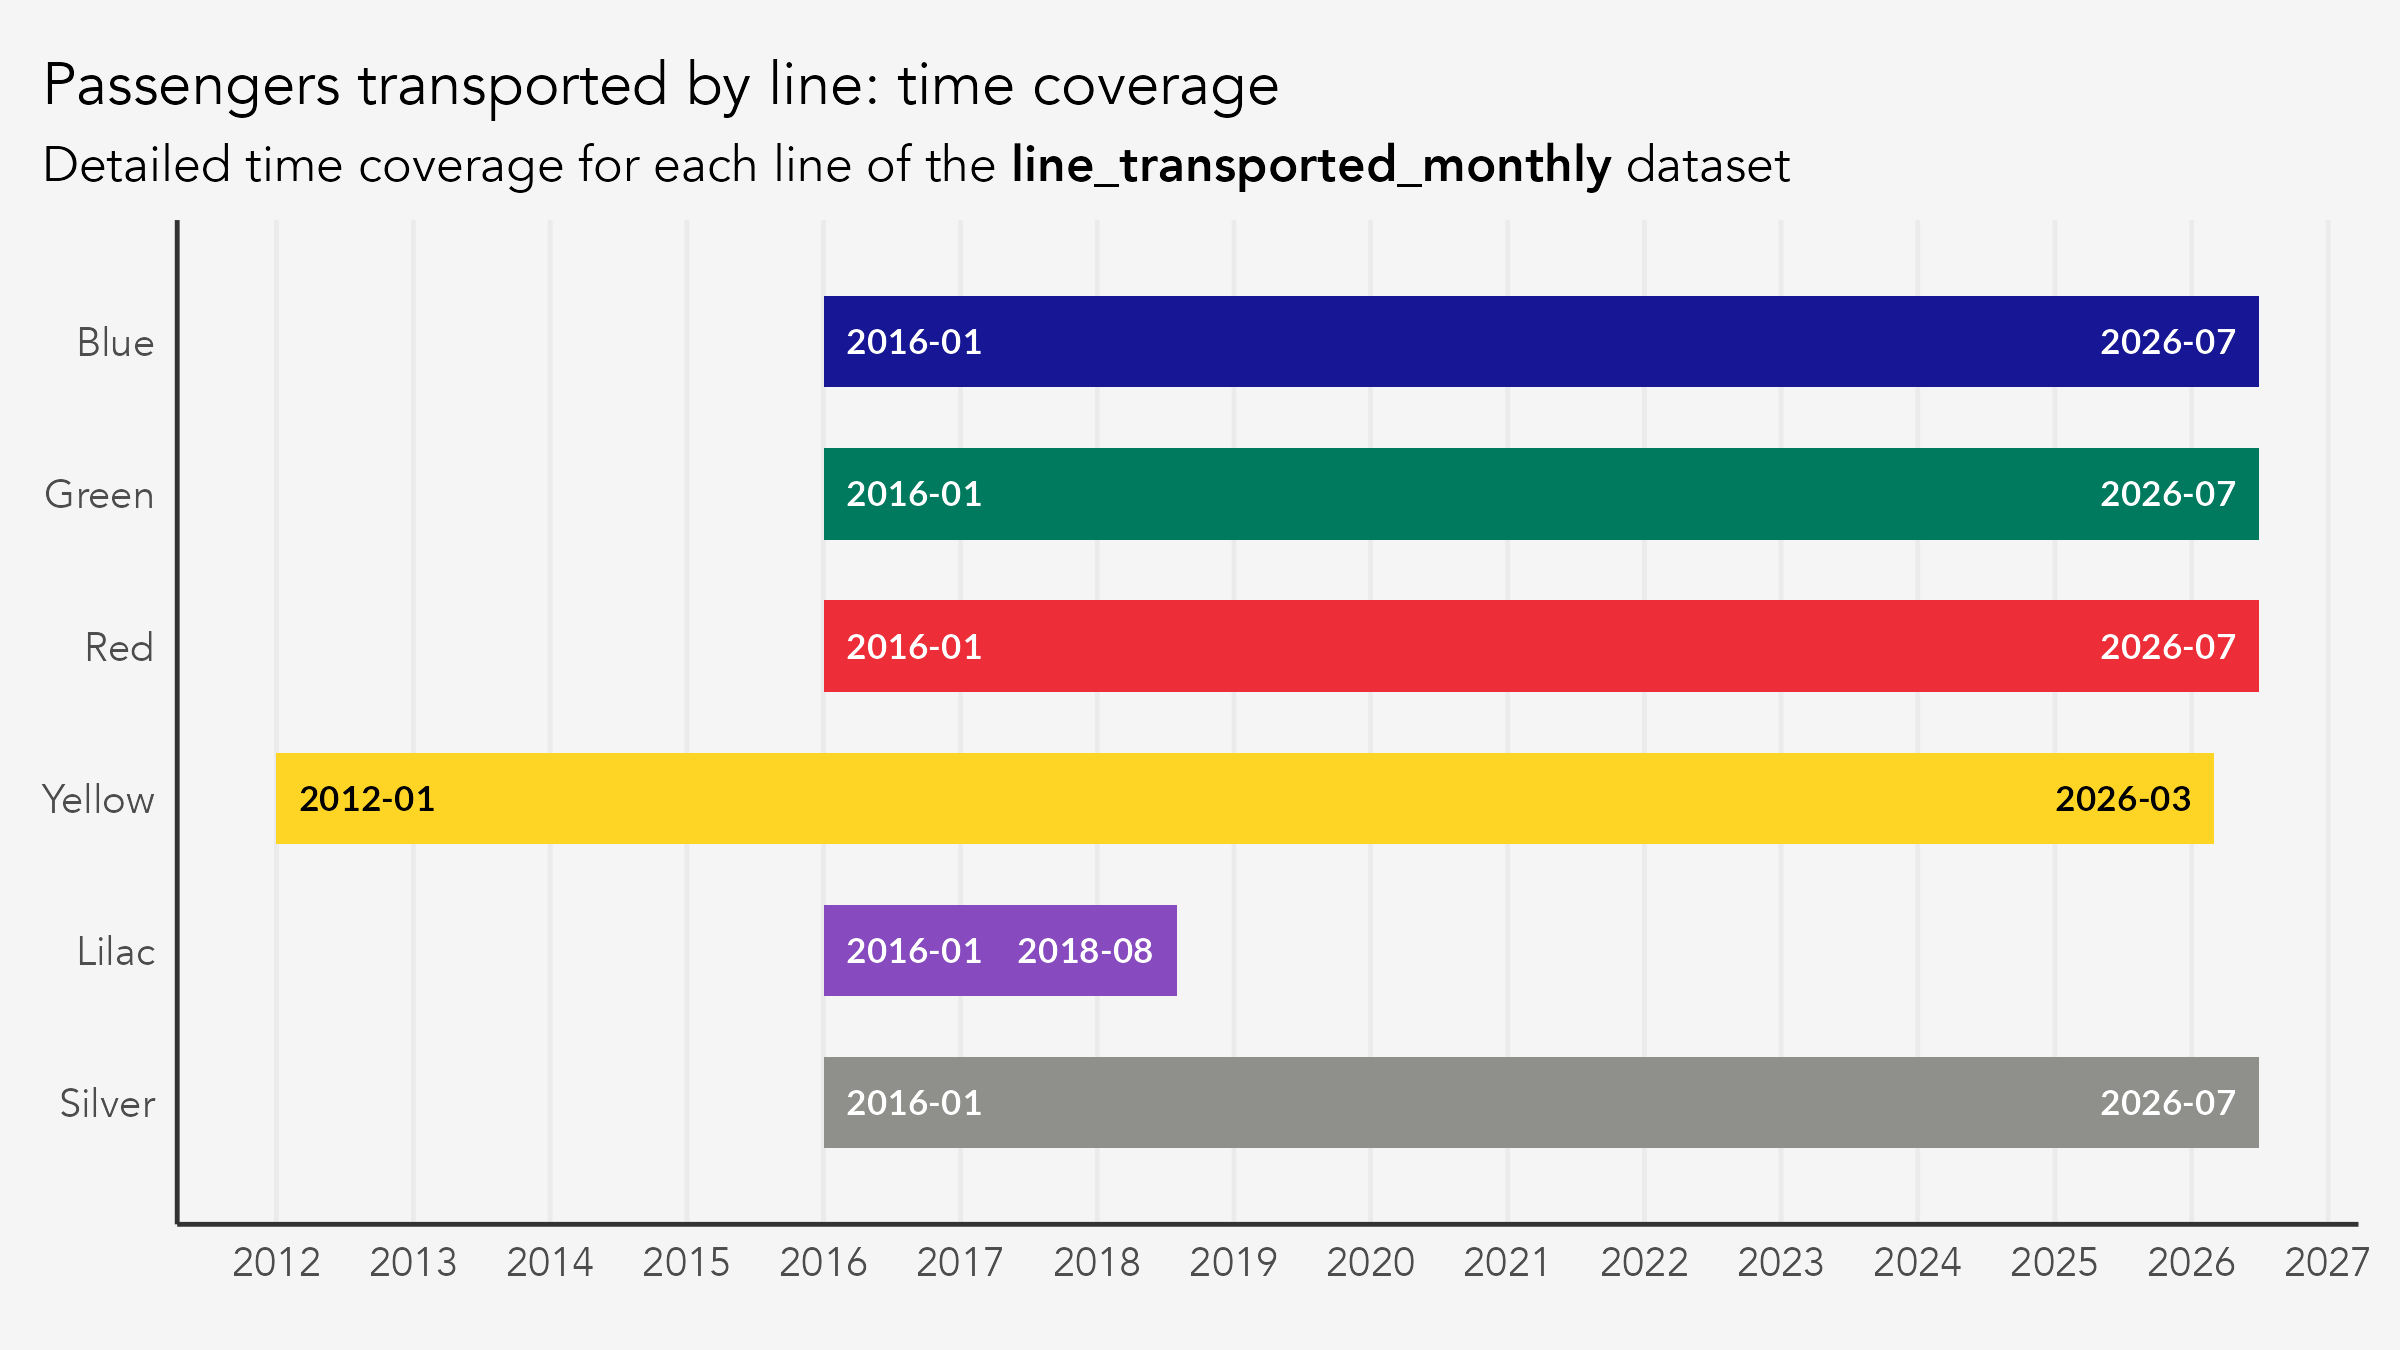
| Line | Source | From | To |
|---|---|---|---|
| 1 – Blue | METRO portal | Jan 2016 | Jul 2026 |
| 2 – Green | METRO portal | Jan 2016 | Jul 2026 |
| 3 – Red | METRO portal | Jan 2016 | Jul 2026 |
| 4 – Yellow | Dataverse | Jan 2012 | Mar 2026 |
| 5 – Lilac | METRO portal | Jan 2016 | Aug 2018 |
| 15 – Silver | METRO portal | Jan 2016 | Jul 2026 |
Line 5 ends in August 2018, when the line passed to ViaMobilidade. The Dataverse feed records turnstiles only, so no transported measure exists for it afterward.
station_transported_monthly
Monthly average weekday passengers transported per station: boardings on that line plus transfers from the other lines. Summed over a line’s stations it usually comes within 2% of the line’s mdu in line_transported_monthly. Line 15 station values are rounded to the thousand, and a few source months differ by more, notably Line 1 from February to June 2016.
dplyr::glimpse(station_transported_monthly)
#> Rows: 9,711
#> Columns: 11
#> $ date           <date> 2012-01-01, 2012-01-01, 2012-01-01, 2012-01-01, 2012-0…
#> $ year           <int> 2012, 2012, 2012, 2012, 2012, 2012, 2012, 2012, 2012, 2…
#> $ line_number    <int> 4, 4, 4, 4, 4, 4, 4, 4, 4, 4, 4, 4, 4, 4, 4, 4, 4, 4, 4…
#> $ station_id     <chr> "butanta", "faria-lima", "luz", "consolacao-paulista", …
#> $ station_name   <chr> "Butantã", "Faria Lima", "Luz", "Paulista", "Pinheiros"…
#> $ line_name      <chr> "Yellow", "Yellow", "Yellow", "Yellow", "Yellow", "Yell…
#> $ line_name_pt   <chr> "Amarela", "Amarela", "Amarela", "Amarela", "Amarela", …
#> $ metric         <chr> "mdu", "mdu", "mdu", "mdu", "mdu", "mdu", "mdu", "mdu",…
#> $ metric_name    <chr> "Average on Business Days", "Average on Business Days",…
#> $ metric_name_pt <chr> "Média dos Dias Úteis", "Média dos Dias Úteis", "Média …
#> $ value          <dbl> 37066.82, 31989.09, 100889.32, 127844.59, 97537.45, 991…
Only the weekday average metric is available at the station level. For line-level data with all five metrics, see line_transported_monthly. Grouping by station_id gives boardings across a complex’s platforms, not people entering it.
Time coverage by line
The time coverage of this dataset varies by line. End dates below are those of the shipped snapshot, not of the upstream source.
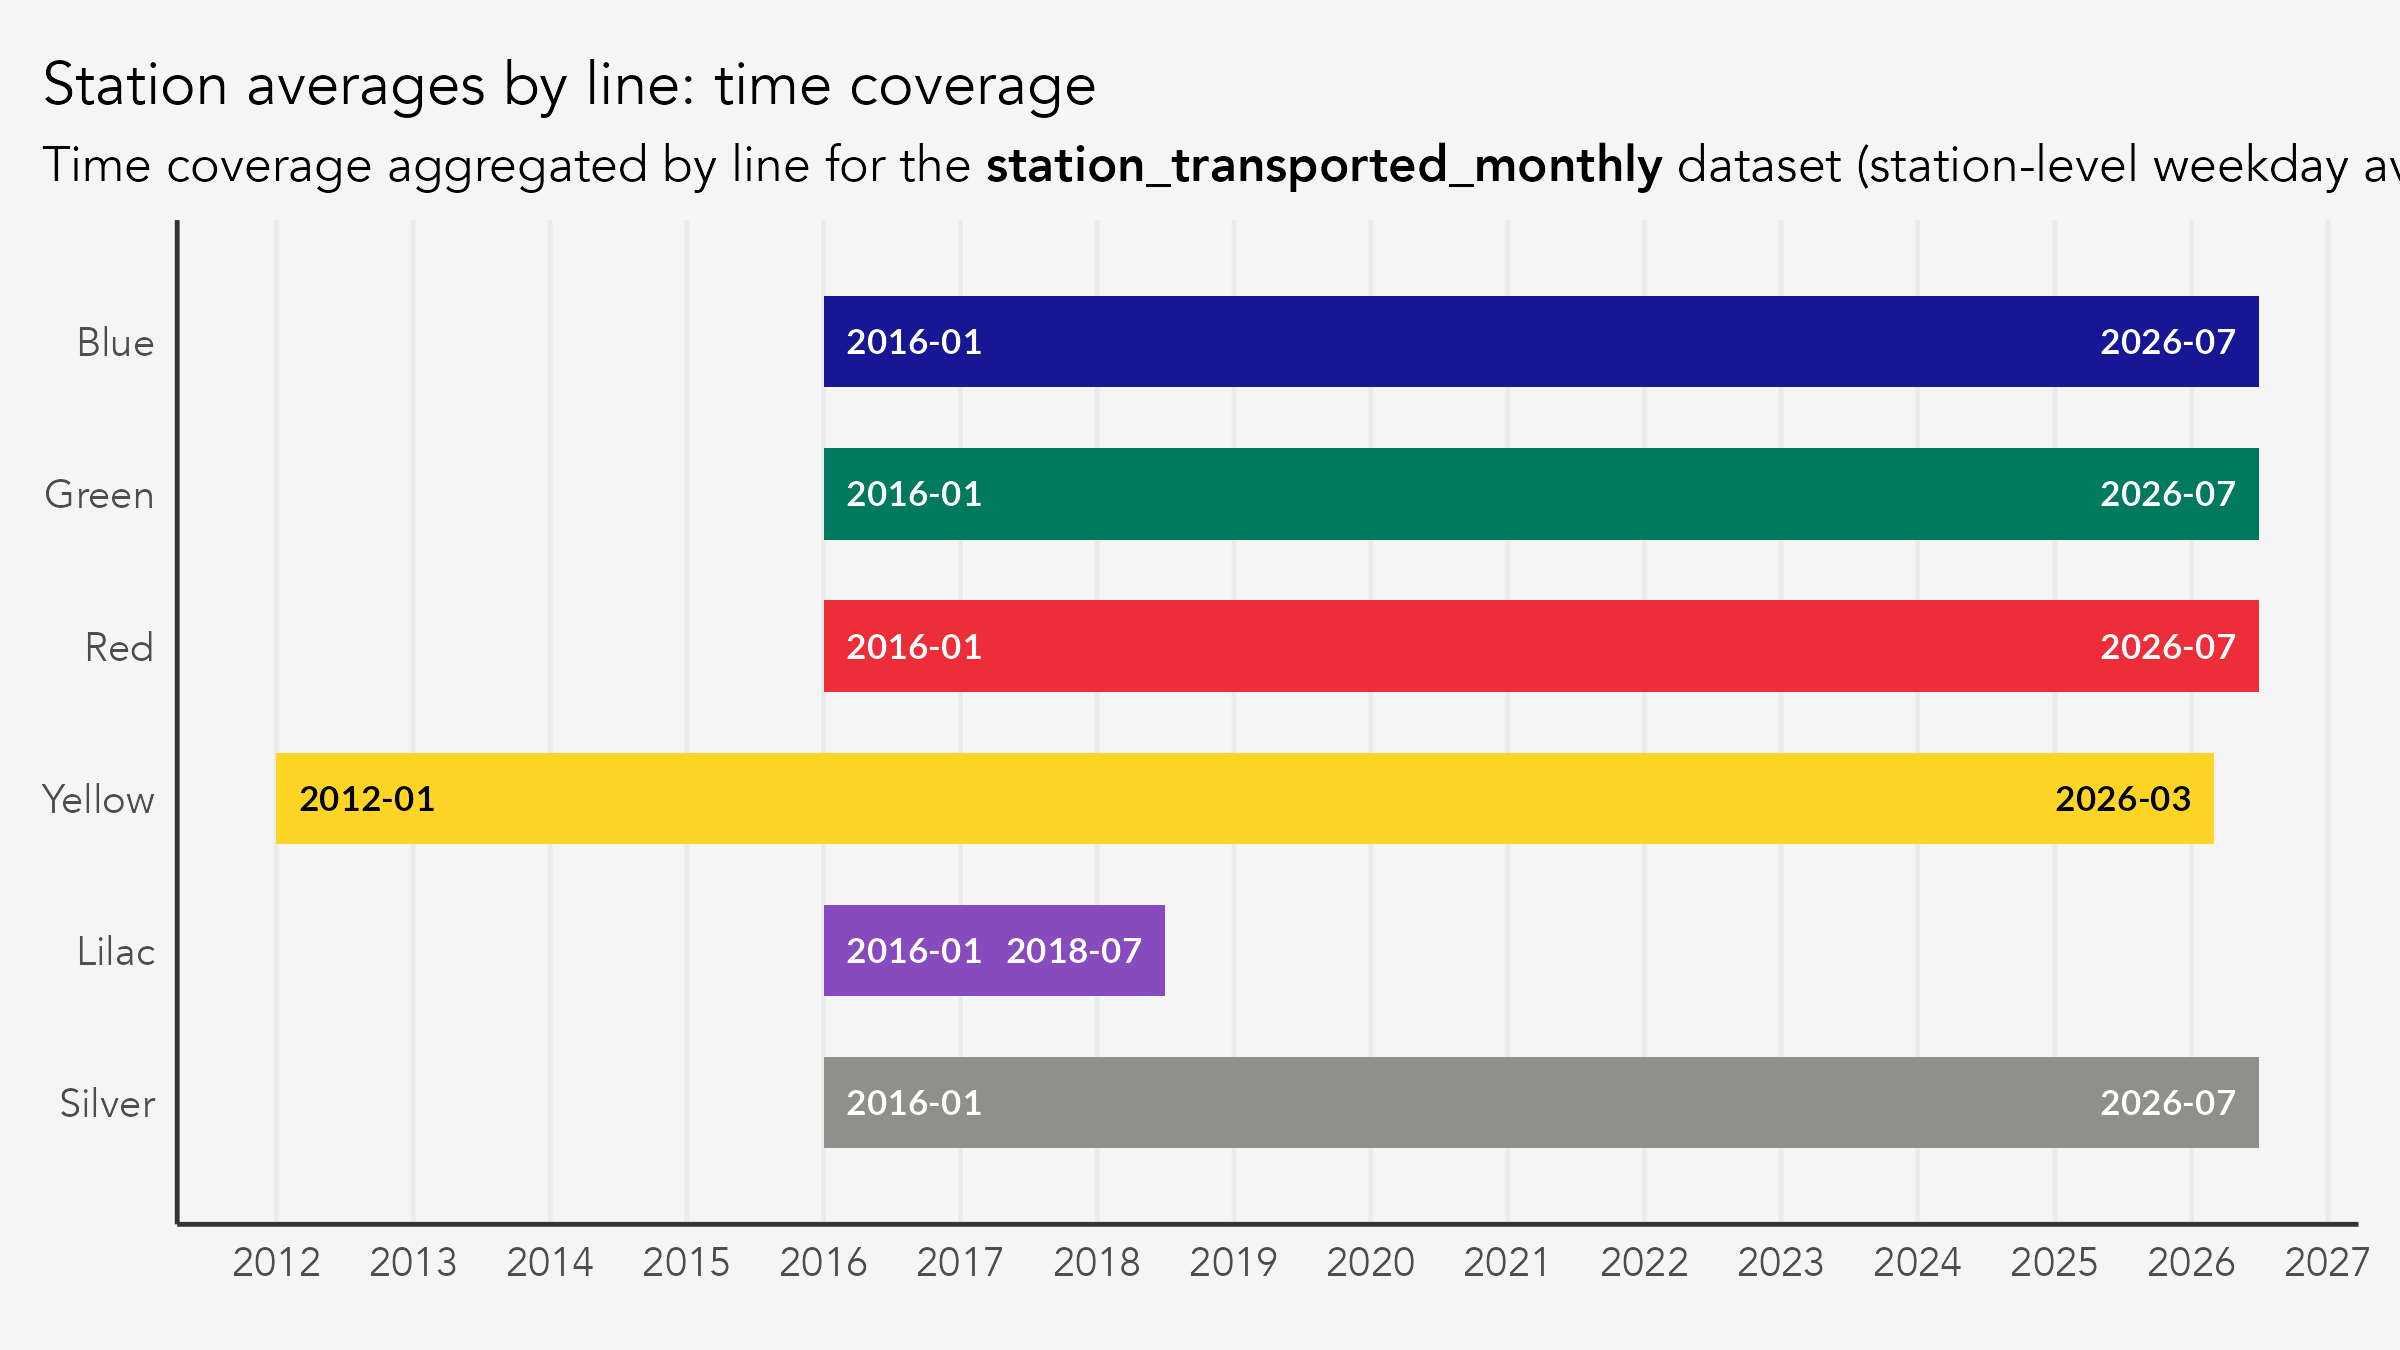
| Line | Source | From | To |
|---|---|---|---|
| 1 – Blue | METRO portal | Jan 2016 | Jul 2026 |
| 2 – Green | METRO portal | Jan 2016 | Jul 2026 |
| 3 – Red | METRO portal | Jan 2016 | Jul 2026 |
| 4 – Yellow | Dataverse | Jan 2012 | Mar 2026 |
| 5 – Lilac | METRO portal | Jan 2016 | Jul 2018 |
| 15 – Silver | METRO portal | Jan 2016 | Jul 2026 |
February through June 2016 carries a defect in the Line 1 values. Across those five months the station sum runs about 14% below the transported mdu in line_transported_monthly, and the figures are misallocated across stations: Santa Cruz and Sé take too large a share, São Bento and Portuguesa-Tietê too small a one. The defect comes from METRO’s retroactive publication of 2016 and is not corrected here, so exclude those five months from station-level baselines.
station_entries_daily
Daily passenger entries at each station: turnstile entries plus transfers arriving from other operators, excluding transfers between METRO lines. Monthly station sums usually match the line’s total in line_entries_monthly; when they differ, the gap is a fraction of a percent.
dplyr::glimpse(station_entries_daily)
#> Rows: 244,174
#> Columns: 9
#> $ date         <date> 2012-01-01, 2012-01-01, 2012-01-01, 2012-01-01, 2012-01-…
#> $ year         <int> 2012, 2012, 2012, 2012, 2012, 2012, 2012, 2012, 2012, 201…
#> $ line_number  <int> 4, 4, 4, 4, 4, 4, 4, 4, 4, 4, 4, 4, 4, 4, 4, 4, 4, 4, 4, …
#> $ station_id   <chr> "butanta", "faria-lima", "luz", "consolacao-paulista", "p…
#> $ station_name <chr> "Butantã", "Faria Lima", "Luz", "Paulista", "Pinheiros", …
#> $ station_code <chr> NA, NA, NA, NA, NA, NA, NA, NA, NA, NA, NA, NA, NA, NA, N…
#> $ line_name    <chr> "Yellow", "Yellow", "Yellow", "Yellow", "Yellow", "Yellow…
#> $ line_name_pt <chr> "Amarela", "Amarela", "Amarela", "Amarela", "Amarela", "A…
#> $ value        <dbl> 7742, 4737, 695, 2277, 332, 25317, 21930, 3923, 14356, 39…
Time coverage by line
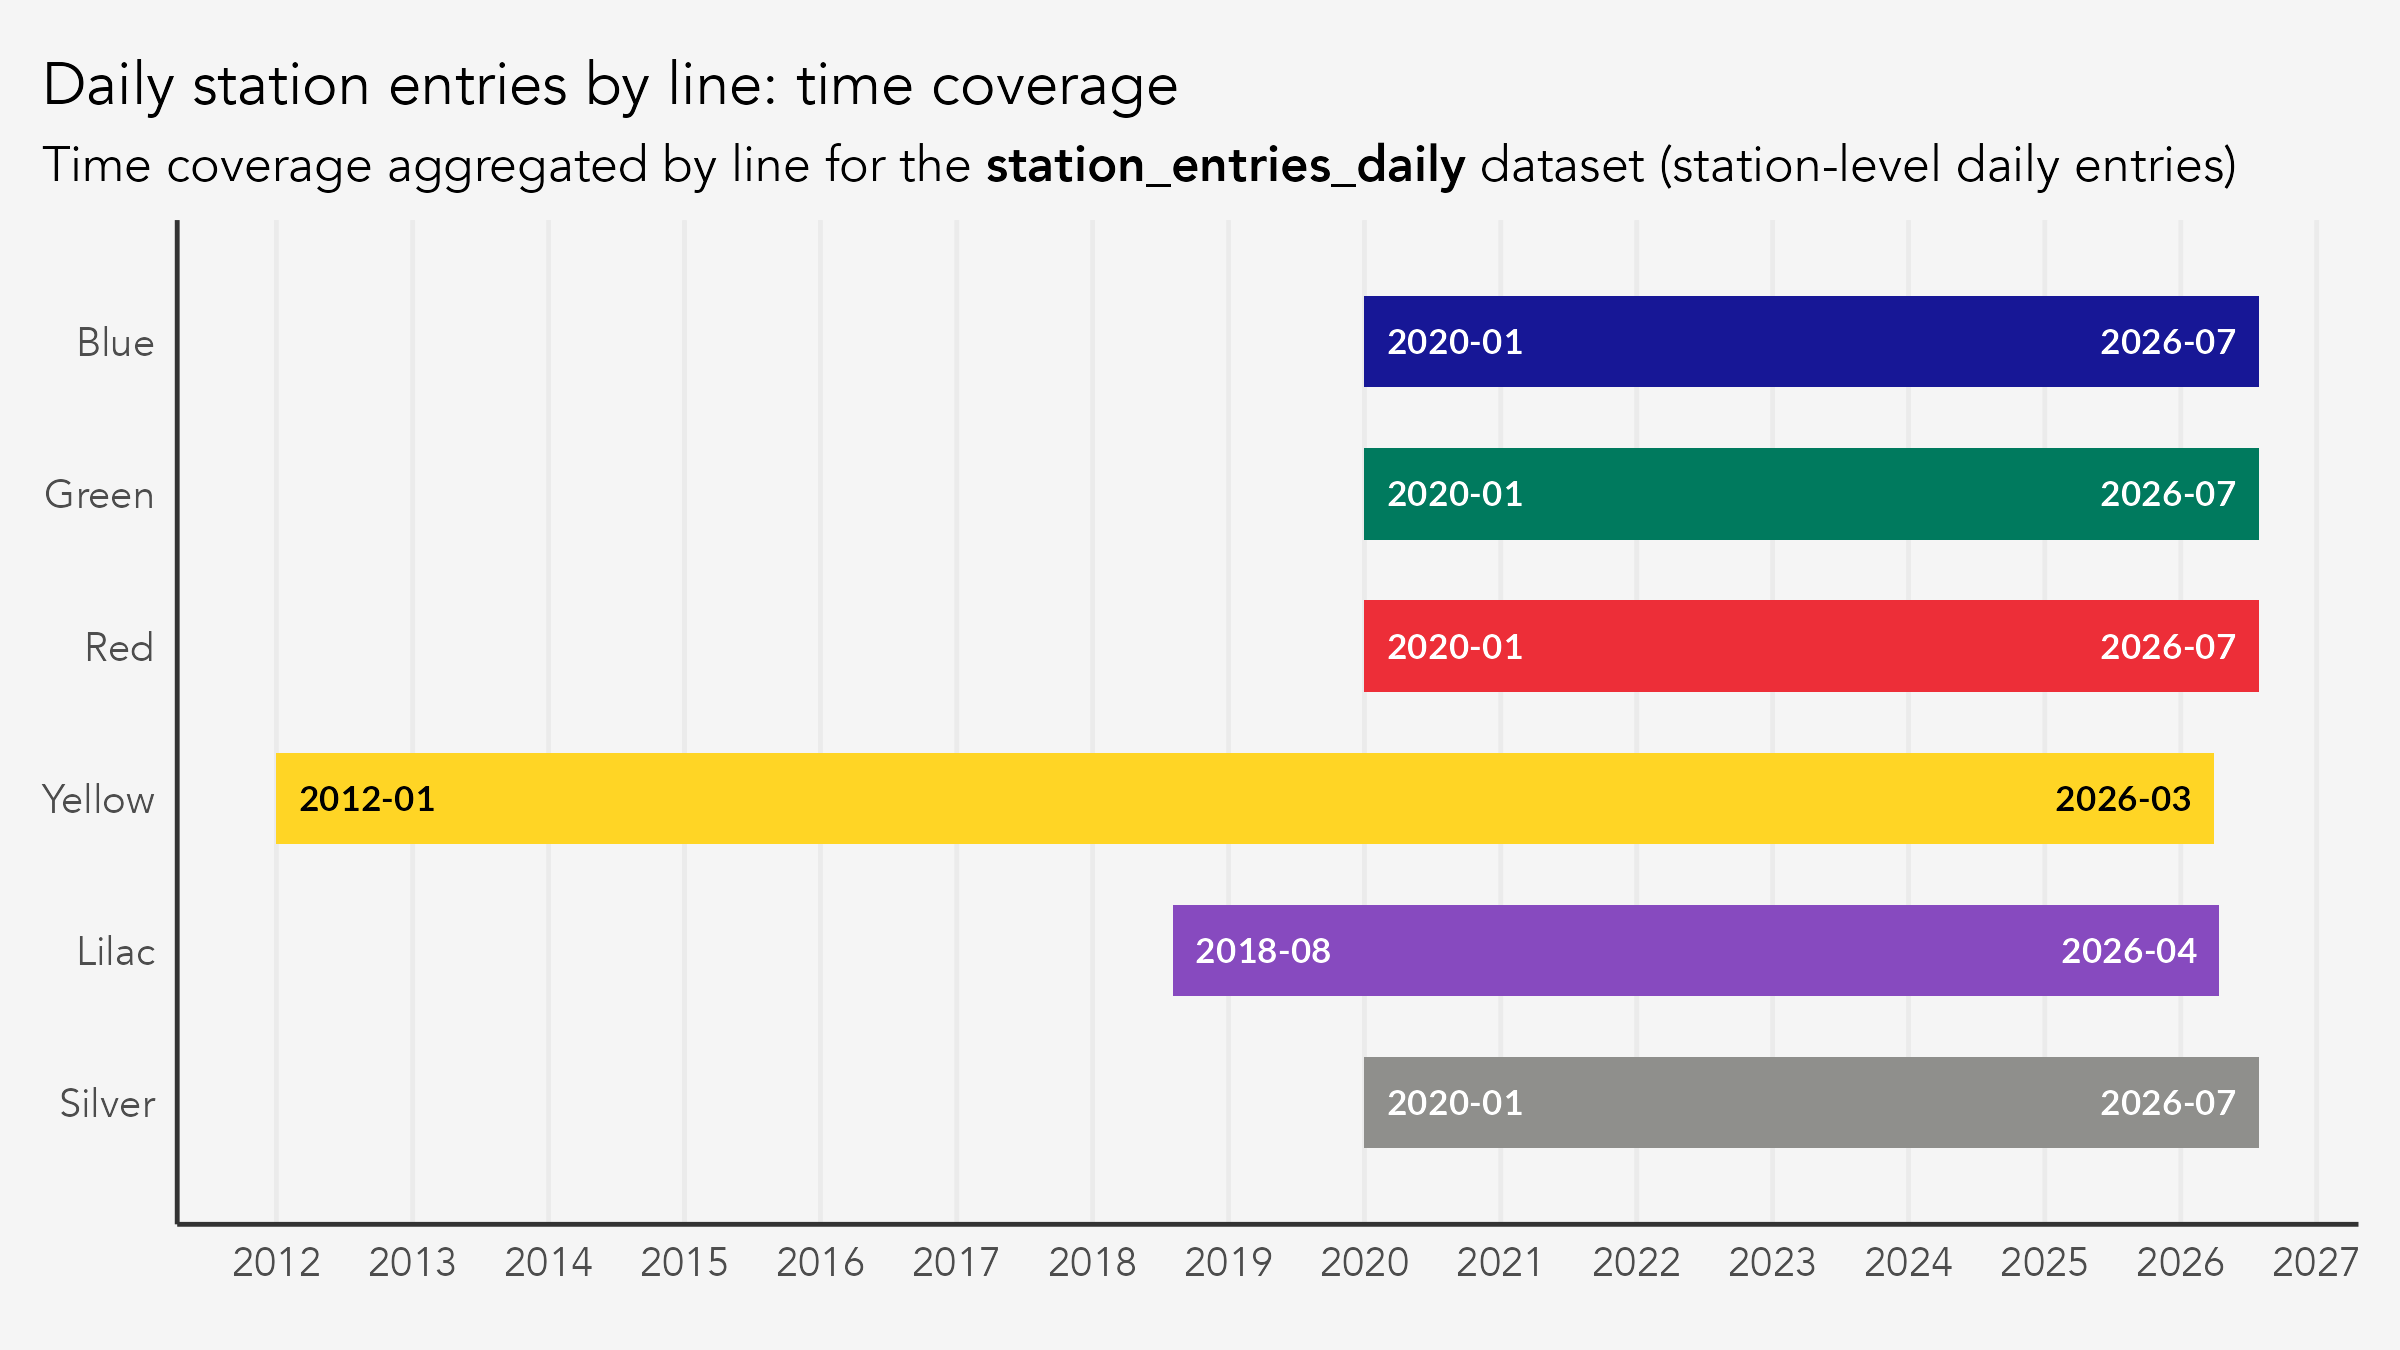
The time coverage of this dataset varies by line. End dates below are those of the shipped snapshot, not of the upstream source.
| Line | Source | From | To |
|---|---|---|---|
| 1 – Blue | METRO portal | Jan 2020 | Jul 2026 |
| 2 – Green | METRO portal | Jan 2020 | Jul 2026 |
| 3 – Red | METRO portal | Jan 2020 | Jul 2026 |
| 4 – Yellow | Dataverse | Jan 2012 | Mar 2026 |
| 5 – Lilac | Dataverse | Aug 2018 | Apr 2026 |
| 15 – Silver | METRO portal | Jan 2020 | Jul 2026 |
Spatial datasets
The rail_lines and rail_stations datasets are sf objects in WGS 84 (EPSG:4326), sourced from GeoSampa. Both include currently operating and planned future infrastructure for METRO SP and CPTM.
rail_lines
dplyr::glimpse(rail_lines)
#> Rows: 55
#> Columns: 7
#> $ line_number  <int> 1, 2, 3, 5, 15, 4, 2, 2, 2, 15, 15, 19, 20, 22, 16, 4, 5,…
#> $ line_name    <chr> "Blue", "Green", "Red", "Lilac", "Silver", "Yellow", "Gre…
#> $ line_name_pt <chr> "Azul", "Verde", "Vermelha", "Lilás", "Prata", "Amarela",…
#> $ company_name <chr> "Metrô", "Metrô", "Metrô", "ViaMobilidade", "Metrô", "Via…
#> $ type         <chr> "metro", "metro", "metro", "metro", "metro", "metro", "me…
#> $ status       <chr> "current", "current", "current", "current", "current", "c…
#> $ geom         <GEOMETRY [°]> LINESTRING (-46.60291 -23.4..., LINESTRING (-46.…
rail_stations
dplyr::glimpse(rail_stations)
#> Rows: 407
#> Columns: 10
#> $ station_id   <chr> "ana-rosa", "armenia", "carandiru", "conceicao", "jabaqua…
#> $ station_name <chr> "Ana Rosa", "Armênia", "Carandiru", "Conceição", "Jabaqua…
#> $ station_code <chr> "anr", "ppq", "cdu", "con", "jab", "lib", "jpa", "luz", "…
#> $ line_number  <int> 1, 1, 1, 1, 1, 1, 1, 1, 1, 1, 1, 1, 1, 1, 1, 1, 1, 1, 1, …
#> $ line_name    <chr> "Blue", "Blue", "Blue", "Blue", "Blue", "Blue", "Blue", "…
#> $ line_name_pt <chr> "Azul", "Azul", "Azul", "Azul", "Azul", "Azul", "Azul", "…
#> $ company_name <chr> "Metrô", "Metrô", "Metrô", "Metrô", "Metrô", "Metrô", "Me…
#> $ type         <chr> "metro", "metro", "metro", "metro", "metro", "metro", "me…
#> $ status       <chr> "current", "current", "current", "current", "current", "c…
#> $ geom         <POINT [°]> POINT (-46.63845 -23.58126), POINT (-46.62934 -23.5…
Transfer stations (e.g., Sé, Paraíso, Ana Rosa) appear once per line they serve.
Auxiliary datasets
Two lookup tables support the core datasets.
-
metro_colors— named character vector of official hex color codes for the six lines with ridership data (e.g.,metro_colors["Blue"]returns"#171796"). Useful for consistent plot styling withscale_color_manual(). -
calendar_spo— daily calendar for the city of São Paulo, 2012–2030, flagging national, state, and municipal holidays and business days. Join ondateto build business-day aggregates fromstation_entries_daily.
Line numbers and their Portuguese/English names are already included as columns on every passenger and station dataset, and the full network line list (including planned and CPTM lines) is available in rail_lines.
Data notes and caveats
Entrance vs. transported
The METRO source files define these terms as:
-
Entrada de passageiros (passenger entries): passengers entering through the turnstile gates (linha de bloqueios). METRO line entries include transfers arriving from Lines 4 and 5, while Lines 4 and 5 count turnstiles only, so no clean network total exists across operators. The
maxmetric cannot be summed because individual lines may peak on different days. - Passageiros transportados (passengers transported): boardings on that line, whether through the turnstile gates or by transferring from another line at an interchange station (e.g. Sé, Paraíso, Ana Rosa, and Vila Prudente). It measures demand carried by each line. Summing lines double-counts interchange journeys and does not give a count of unique network passengers.
The original Portuguese footnote reads:
Corresponde à soma das entradas pela linha de bloqueios com as transferências entre linhas nas estações […].
Station-level transfer counting
At interchange stations, the METRO source reports separate figures per line. For example, at Paraíso (Lines 1 and 2):
- Line 1 figure = passengers boarding Line 1 + transfers from Line 2
- Line 2 figure = passengers boarding Line 2 + transfers from Line 1
This means station-level totals at interchange stations are not double-counted within a single line, but summing across lines at the same interchange would overcount. The affected stations and their lines are listed below. Note that some of these stations have interchange with the train (CPTM) network.
| Station | Lines |
|---|---|
| Ana Rosa | 1, 2 |
| Luz | 1, 4, 10, 11 (CPTM) |
| Paraíso | 1, 2 |
| Santa Cruz | 1, 5 |
| Sé | 1, 3 |
| Chácara Klabin | 2, 5 |
| Consolação–Paulista | 2, 4 |
| Tamanduateí | 2, 10 (CPTM) |
| Vila Prudente | 2, 15 |
| Brás | 3, 10, 11, 12 (CPTM) |
| Corinthians-Itaquera | 3, 11 (CPTM) |
| Palmeiras-Barra Funda | 3, 7, 8 (CPTM) |
| República | 3, 4 |
| Tatuapé | 3, 11, 12 (CPTM) |
Line 5 ownership change
Line 5 (Lilás) was originally operated by METRO SP. On August 4, 2018, it was handed over to ViaMobilidade under a concession contract. This affects the data in two ways:
- Source switch: from January 2016 through July 2018, Line 5 data comes from the METRO transparency portal. From August 2018 onward, it comes from the Insper Dataverse (ViaMobilidade/Insper partnership).
-
Transported counts end: the METRO portal has Line 5 transported data through August 2018, the month of the ownership handover. The Dataverse feed records turnstiles only, so
line_transported_monthlyhas no Line 5 data afterward andstation_transported_monthlydrops Line 5 from August 2018 onward (station data for that era lives instation_entries_daily). The August 2018 row covers only the days before the handover: itstotalis a partial month, andmsaandmdoareNA.
Line 15 Sunday closures
In February and March 2018, Line 15 (Prata) was closed on Sundays for control system testing. Sunday averages (mdo) for these months reflect zero or near-zero ridership, which is a testing artifact rather than demand.
Rounding in station averages
The METRO source rounds station-level averages to the nearest thousand. The sum of individual station values may not equal the line total due to this rounding. The original note states:
O total da linha pode ser diferente da soma das estações devido ao arredondamento.
Lines 4 and 5: station codes
The station_code column (three-letter abbreviation) is only available for METRO-operated lines (1, 2, 3, 15). Lines 4 and 5 have station_code = NA because these abbreviations are internal to METRO SP and not used by ViaQuatro/ViaMobilidade.
2017 source formats
The METRO transparency portal publishes January through September 2017 only as PDFs; machine-readable CSVs begin in October 2017. The PDFs carry no text layer, so those nine months were transcribed from the rendered pages and reconciled against the published totals.
One defect in the source survives the transcription. July 2017 has no entrance table: the file published under that name repeats the transported figures, so Lines 1, 2, 3, 5, and 15 have no entrance value that month.
If a 2017 figure looks wrong, please open an issue.
Trailing months and NA values
Months (or days, for station_entries_daily) beyond the last published data point for each line are trimmed during assembly, so the datasets do not contain unpublished trailing NA rows. Interior NA values — for example, days when Line 15 (Silver) was not operating — are preserved as-is.
Source attribution
The datasets in this package are heavily processed and curated, so cite the package as well as the original producers. Run citation("metrosp") for the entry.