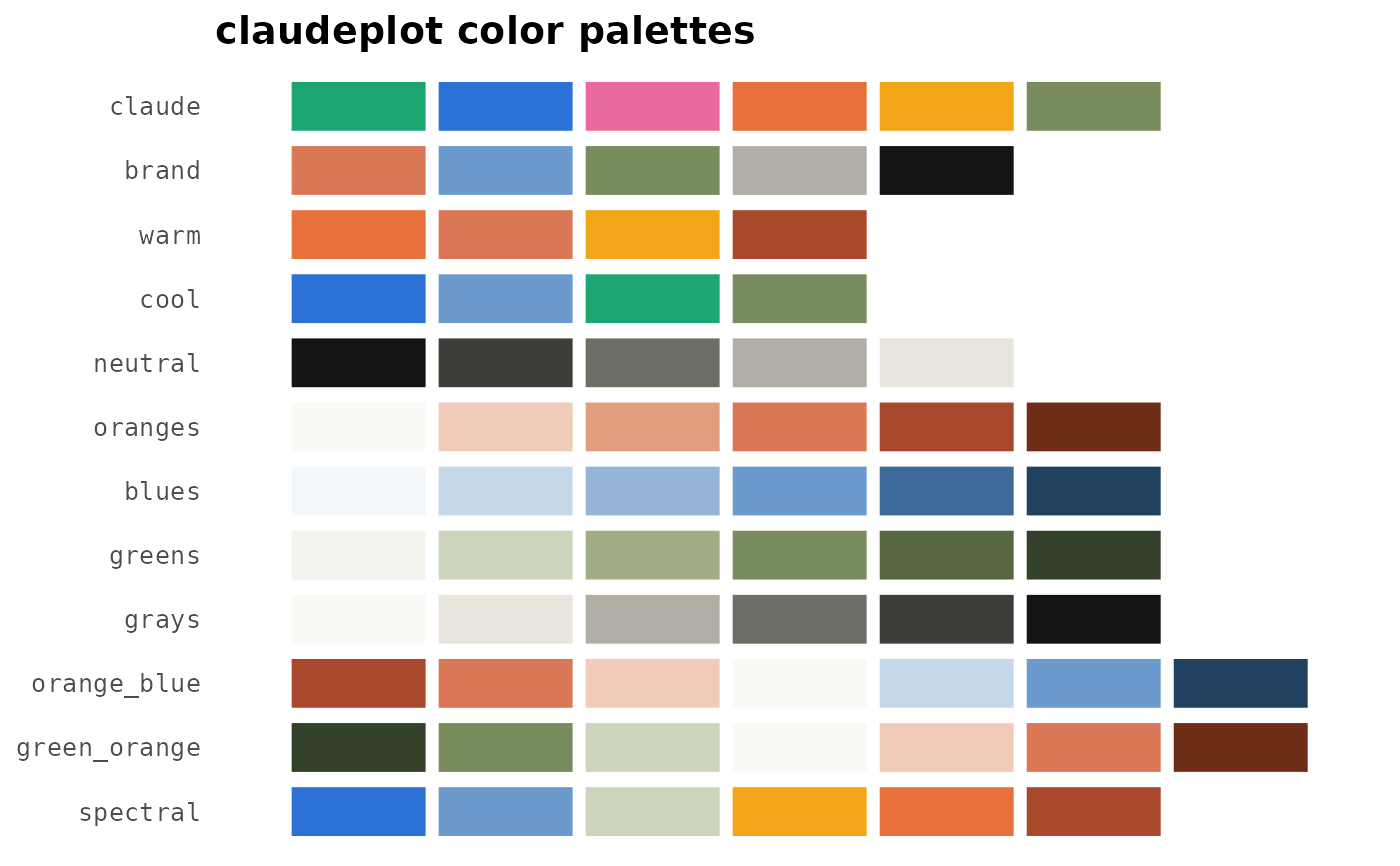
Draws every palette (optionally filtered by type) as a stacked grid of color swatches.
Usage
show_claude_palettes(type = c("all", "qualitative", "sequential", "diverging"))See also
show_claude_palette() to display one palette in detail.
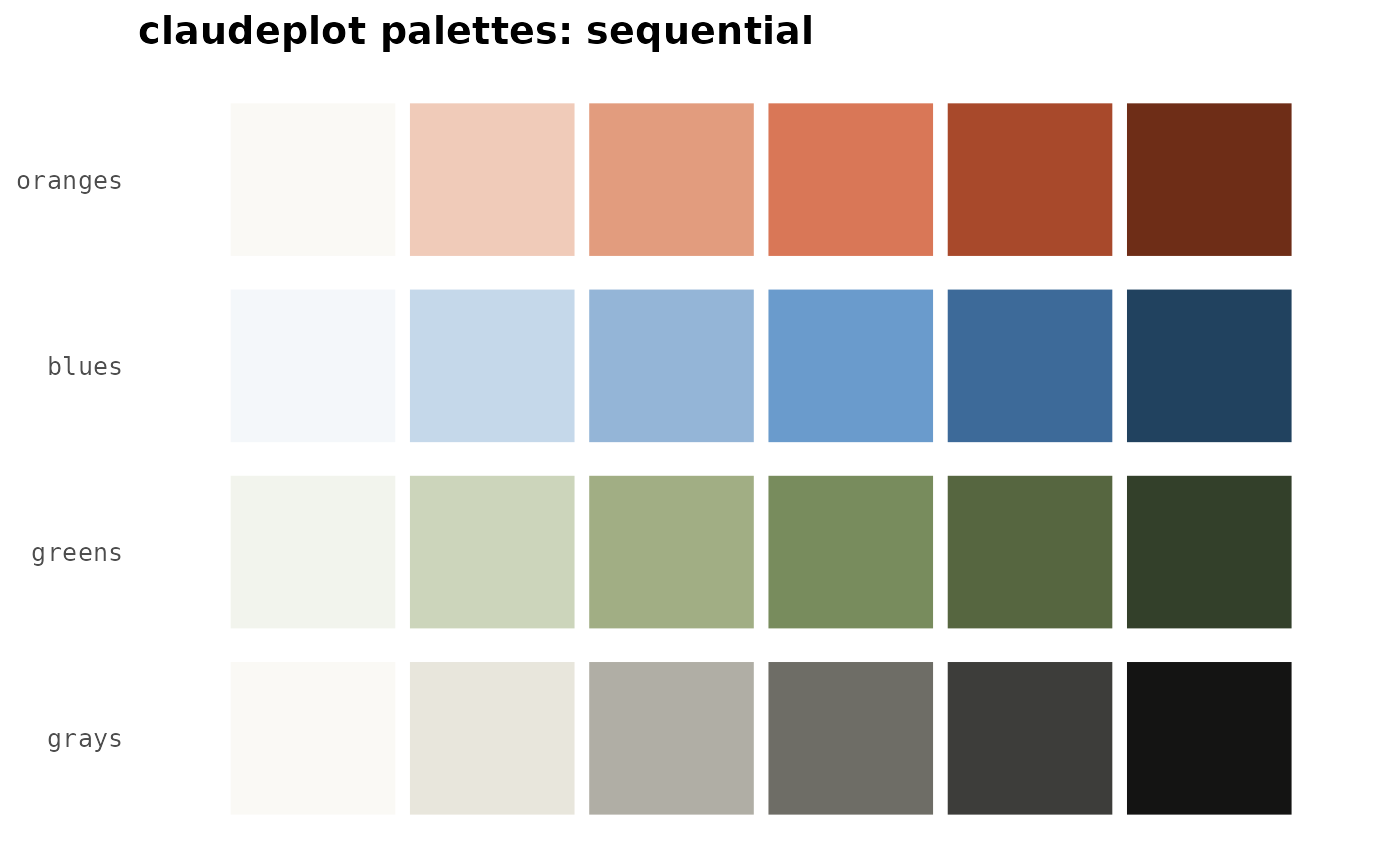
Draws every palette (optionally filtered by type) as a stacked grid of color swatches.
show_claude_palettes(type = c("all", "qualitative", "sequential", "diverging"))show_claude_palette() to display one palette in detail.